




Copilot in Excel is not autocomplete for spreadsheets. It is a prompt interface that writes formulas, explains what a workbook is doing, builds PivotTables and charts, and — combined with Python in Excel — runs real data-science code from plain language. It is also easy to over-trust: it cannot see a closed workbook, it degrades hard on messy ranges, and it will hand you a formula that looks right and returns the wrong number.
This is a companion post in explainx.ai's Microsoft 365 Copilot series — start at the Microsoft 365 Copilot beginner's guide if you have not set up Copilot at all yet. This guide is scoped to Excel specifically: what to prompt, what to verify, and where it breaks.
TL;DR — prompts and what Copilot actually does
| Prompt | What Copilot does | Watch out for |
|---|---|---|
| "Write a formula that flags orders over 90 days late" | Generates a working formula (often IF/AND nested) in the selected cell | Check it references the right Table/column names |
| "Analyze this data" | Summarizes trends, outliers, and top/bottom values as a written insight panel | Scoped to the active Table, not the whole workbook |
| "Create a PivotTable of revenue by region and month" | Builds and inserts a working PivotTable on a new sheet | Source range must already be a Table |
| "Chart this as a line graph by quarter" | Inserts a formatted chart, picks a reasonable chart type | Ask for a specific chart type if the default guess is wrong |
| "Highlight duplicate rows in this column" | Suggests or applies conditional formatting | Confirm the applied rule before deleting "duplicates" |
| "Forecast next quarter using this trend, use Python" | Hands off to Python in Excel: writes pandas/scikit-learn code in a cell | Requires Python in Excel enabled separately |
| "Explain this formula" | Breaks a nested formula into plain-language steps, no edits made | Good for auditing someone else's spreadsheet |
| "Clean up this data" | Suggests trimming whitespace, fixing types, standardizing formats | Review before applying to a whole column |
How to turn on Copilot in Excel
Copilot in Excel needs three things lined up before the icon even shows up on the ribbon:
- A qualifying license. A commercial Microsoft 365 Copilot subscription, a Copilot Chat-eligible business/enterprise plan, Microsoft 365 Premium, or a Personal/Family subscription with an AI credits plan.
- The file saved to OneDrive or SharePoint, in
.xlsx,.xlsb, or.xlsmformat, with AutoSave on. Copilot does not work on a local-only, unsaved file. - Content-analysis permissions turned on. Go to File > Account > Manage Settings (under Account Privacy) and enable "Experiences that analyze your content" and "All connected experiences."
 Microsoft Copilot in Excel: a natural-language prompt turning into a formula, chart, and Python code block inside a spreadsheet grid
Once those are set, install the latest Microsoft 365 updates, go to File > Account > Update License, and restart Excel. The Copilot icon appears on the Home ribbon and opens a chat pane docked to the right of the grid.
Before you prompt anything: convert your data range to a Table with Ctrl+T. This single step fixes more Copilot accuracy problems than anything else in this guide — Copilot reasons about named columns and defined boundaries, not raw cell ranges.
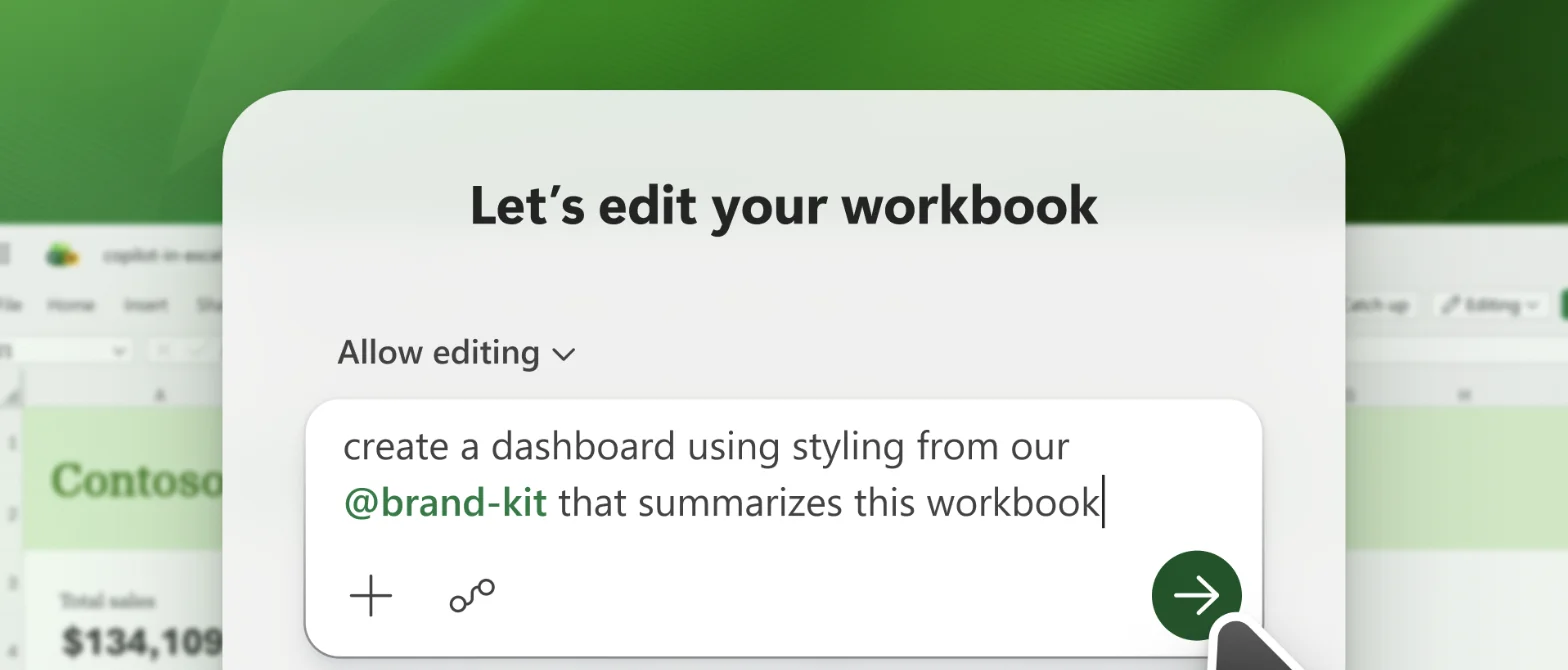 Microsoft Copilot in Excel prompt box asking to create a dashboard using brand-kit styling that summarizes the workbook
Screenshot: the real Copilot in Excel prompt pane, from Microsoft's official "Get started with Copilot in Excel" support page.
Natural-language formula generation
Type a plain-English instruction in the Copilot pane, or start typing = in a cell and let the natural-language autocomplete suggest a formula. Examples that work well:
Write a formula that returns "Late" if the ship date is more than 5 days
after the order date, otherwise "On Time"

Sum the Amount column where Status is "Paid" and Region is "West"

Find the third-highest value in the Revenue column
Copilot proposes the formula inline and, on request, explains each part in plain language before you accept it. It can also explain existing formulas — paste a gnarly nested IF/INDEX/MATCH formula from someone else's workbook and ask "explain this formula" to get a step-by-step breakdown without changing anything.
A deprecation to know about: Microsoft is retiring the in-cell =COPILOT() function itself on September 14, 2026. If you or a colleague built formulas around =COPILOT("classify this", A2:A100), those will stop returning results after that date — convert them to static values or move that logic to the chat-pane workflow before then. This is separate from the Copilot pane and chat features described in this guide, which are not affected.
"Analyze this data" — the prompt that does the most work
The single highest-leverage prompt in Copilot in Excel is some variant of "analyze this data" or "what stands out in this table?" Ask it against a Table and Copilot returns:
- Summary statistics (totals, averages, min/max) scoped to relevant columns
- Trend callouts ("Revenue in the West region dropped 14% in Q3")
- Outlier flags (single rows that break a pattern the rest of the column follows)
- Suggested follow-up questions you can click instead of retyping
This works on the active Table in the open workbook only. It does not crawl your OneDrive, does not read other tabs unless they are referenced, and cannot merge insight across two separate files you haven't both opened.
Python in Excel + Copilot: the combo for real analysis
Python in Excel is a distinct Excel feature — it runs a sandboxed Python environment inside a cell, with pandas, matplotlib, and scikit-learn available. Copilot's job on top of it is translation: you describe the analysis in natural language, and Copilot writes the Python and drops it into a =PY() cell for you.
Prompt: "Forecast next quarter's revenue based on the last 8 quarters,
using a simple linear regression, and plot it"

Copilot writes (roughly):
import pandas as pd
from sklearn.linear_model import LinearRegression
import matplotlib.pyplot as plt
# ... loads xl("Revenue[#All]"), fits a regression, plots forecast
This is where Copilot in Excel moves past formula-writing into actual data science — forecasting, clustering, basic machine learning — without the user needing to know pandas syntax. Two things to plan around:
- Python in Excel needs to be enabled separately from Copilot itself; it has its own rollout wave and licensing footprint, so check it is on for your tenant before promising this workflow to a team.
- Python runs in a Microsoft-managed sandbox, not on your machine — data leaves the local session to execute, which is a real consideration if you're working with anything regulated.
Formatting suggestions, charts, and PivotTables from prompts
Copilot handles the "I know what I want, I just don't want to click through the ribbon" category of requests well:
- Formatting: "Make negative numbers red," "highlight rows where the deadline has passed," "clean up inconsistent date formats in this column" — Copilot proposes a rule or transformation you approve before it applies.
- Charts: "Chart revenue by month as a line graph," "compare these two regions in a bar chart" — Copilot picks a chart type and formats it, though it is worth explicitly naming the chart type you want rather than trusting its default guess on ambiguous data.
- PivotTables: "Build a PivotTable summarizing units sold by product category and quarter" generates a working PivotTable on a new sheet, with rows/columns/values assigned from your description.
All three work best — often only work correctly — when the source data is a Table, not a loosely formatted range with merged cells or inconsistent headers.
What Copilot in Excel cannot do
Ship this list to anyone on your team before they start trusting Copilot output unread:
- No visibility into closed workbooks. Copilot reasons only about the active, open workbook. A prompt like "compare this to last quarter's file" fails silently or hallucinates unless that other file is also open.
- Degrades sharply on unstructured ranges. Hand-built layouts — merged cells, mixed currencies, free-text fields standing in for structured columns — are the most common cause of wrong Copilot answers. Convert to a Table first.
- Formula errors you must verify. Generated formulas can fail when a column or table name in the formula doesn't exactly match the workbook, or when a structured reference like
Table1[Amount]is used against data that isn't actually a Table. Test on a handful of rows before applying to a full column — never paste a Copilot formula across a production sheet unchecked. - Practical size ceiling. Interactive, Table-based Copilot analysis stays responsive up to roughly one to two million cells; past that, expect slower responses and a higher error rate rather than a hard failure.
- Turn-based, not a standing job. Copilot in Excel answers the prompt you send — it does not run on a schedule or watch a file for changes. For genuinely recurring automation, see how Microsoft 365 Copilot handles (and doesn't handle) loops.
What this means for what you build or pay
| If you're an individual analyst | If you're rolling this out to a team |
|---|---|
| Convert working ranges to Tables as a default habit, not a one-off fix | Standardize on Table-formatted templates before training anyone on Copilot prompts |
| Treat every generated formula as a draft, spot-check on real rows | Build a short internal checklist: verify formula references, confirm PivotTable source, sanity-check Python output |
| Budget the license — Copilot in Excel needs a paid tier, not the free Excel license | Confirm Python in Excel is enabled separately if forecasting/ML prompts matter to your workflow |
Watch the September 14, 2026 =COPILOT() retirement if you built formulas on it | Audit shared workbooks for =COPILOT() formulas before the cutoff |
Related reading
explainx.ai Microsoft Copilot series
- Microsoft 365 Copilot: beginner's guide
- Microsoft Copilot in Word: what it can actually do
- Microsoft Copilot in Teams: meeting recap guide
- Microsoft 365 Copilot pricing and licensing
- What is Copilot Studio? Build your first agent
- How to run loops in Microsoft 365 Copilot
- Microsoft MAI hill-climbing: Copilot and Excel
Microsoft documentation
- FAQ about Copilot in Excel
- Introducing Copilot support for Python in Excel
- App and network requirements for Microsoft Copilot admins
Dictionary: Microsoft 365 Copilot · Copilot · Copilot Studio · Python in Excel
Feature names, licensing tiers, and the =COPILOT() function retirement date reflect Microsoft's documentation as of August 2026. Rollout waves and exact prompts vary by tenant and Excel build — verify against Microsoft Learn before relying on this in production workbooks.