



LiteLLM already sits in the request path for a lot of enterprise model traffic. On September 30, 2026, CTO Ishaan Jaffer used that fact as the launch argument for Lens: if the gateway sees every call, it can also help you debug the agent runs those calls belong to.
The official Lens launch post is short on screenshots and long on a three-panel pitch — every call through one choke point, one trace per run (steps, tokens, cost), then insight flowing back into routing, prompts, and evals. That is a product bet, not a market-share measurement. Jaffer's "enterprise AI traffic chokepoint" line is LiteLLM's positioning. It is not an independently counted share of production requests.
explainx.ai's read is narrower. If you already run LiteLLM the way AT&T routes coding traffic, Lens is worth the waitlist. If you are on OpenRouter or a local OmniRoute proxy, do not migrate the gateway just to get this analyzer.
TL;DR: what people are asking
| Question | Answer |
|---|---|
| What shipped? | LiteLLM Lens, announced Sep 30, 2026 by CTO Ishaan Jaffer. Early access / waitlist. |
| What does it analyze? | OpenTelemetry traces sent through the LiteLLM proxy — not a separate SaaS ingest by default. |
| What does it output? | Grouped recurring failures, linked back to traces, plus SQL/API investigation. |
| Where does data live? | ClickHouse for traces, PostgreSQL for investigation results; analyzer is customer-hosted. |
| Who calls the judge model? | The analyzer calls a model through LiteLLM, on your infra. |
| Is "200,000 traces" real usage? | No. Future scenario / design target, not reported volume. |
| Hosted Langfuse replacement? | No. Gateway-side debugging for teams already on LiteLLM. |
| Switch from OpenRouter/OmniRoute? | No — not for Lens alone. |
What Lens actually does (and what it does not)
A single agent run is not one chat completion. It is a tree: planner call, tool call, MCP round-trip, retry, second model, spend write-back. A failure at the end of that tree is almost never visible in a request log that only stores the last HTTP 200.
Lens's documented workflow is investigation, not live tailing:
- Instrument agents so OpenTelemetry traces reach the LiteLLM proxy.
- Define what a good run looks like — followed the process, recovered from a tool error, stayed inside a budget.
- Select a set of executions (manual or scheduled).
- Let the analyzer group similar failures and point engineers at example traces.
That last step is the product. A trace records one run. An investigation is supposed to find repeated failure modes across many runs so nobody pages through 4,000 spans by hand.
It does not claim the agent will rewrite itself. Grouping failures is not a closed eval loop. You still need golden cases, deterministic checks, and a human who can say which cluster is a real bug versus a flaky tool.
Jaffer also pitched agent-first APIs, SQL over traces, and letting Codex or Claude Code query the data without a hosted tracing platform's rate limits. That is a self-serve investigation path for teams that already treat the proxy as the system of record. It is not a promise that Lens is faster than Grafana Tempo or a warehouse you already query.
Customer-hosted architecture: ClickHouse, Postgres, analyzer
The early-access setup is explicit about data residency. That is the interesting part for security and platform teams, and it is also the operational cost.
| Piece | Role |
|---|---|
| LiteLLM proxy | Ingests OpenTelemetry traces; remains the routing and spend choke point. |
| ClickHouse | Stores trace data (high-volume, append-heavy). |
| PostgreSQL | Stores investigation results (queries, groupings, findings). |
| Analyzer worker | Runs on customer infrastructure, connected to the proxy. |
| Judge / investigation model | Called through LiteLLM, using whatever model the customer already routes. |
You operate two databases plus a worker. That matches LiteLLM's self-hosted story. It is also extra moving parts compared with "turn on a cloud exporter and look at a dashboard." If your org already forbids sending prompts and tool payloads to a third-party observability SaaS, this layout is the point. If you do not want to run ClickHouse, Lens is not a free lunch.
Secondary coverage on RuntimeWire (Oct 1, 2026) matches the same split: traces in ClickHouse, findings in Postgres, analyzer on-prem relative to the customer, model calls via LiteLLM. Treat that write-up as a restatement of the launch, not as independent telemetry.
How this sits on OpenTelemetry v2
Lens is not a replacement for LiteLLM's existing exporter story. The proxy already has OpenTelemetry v2 — opt-in, off until you set LITELLM_OTEL_V2=true — documented as OpenTelemetry v2.
OTel v2's job is one clean tree per proxy request: incoming HTTP, auth (including Postgres key lookups), guardrails, the LLM span, then spend/cache DB writes. Spans follow OpenTelemetry GenAI semantic conventions (gen_ai.* attributes: model, provider, tokens, cost, finish reasons). Prompts and responses stay out unless you opt in. Health checks and UI assets are dropped. If the client sends traceparent, LiteLLM's spans nest in the caller's distributed trace.
That is the plumbing Lens wants to sit on. A coding agent that fans out through the proxy can attach session identity (x-litellm-trace-id / session metadata — the same header LiteLLM already uses for agent iteration budgets) so tool calls and model calls collapse into one run instead of a pile of unrelated /v1/chat/completions.
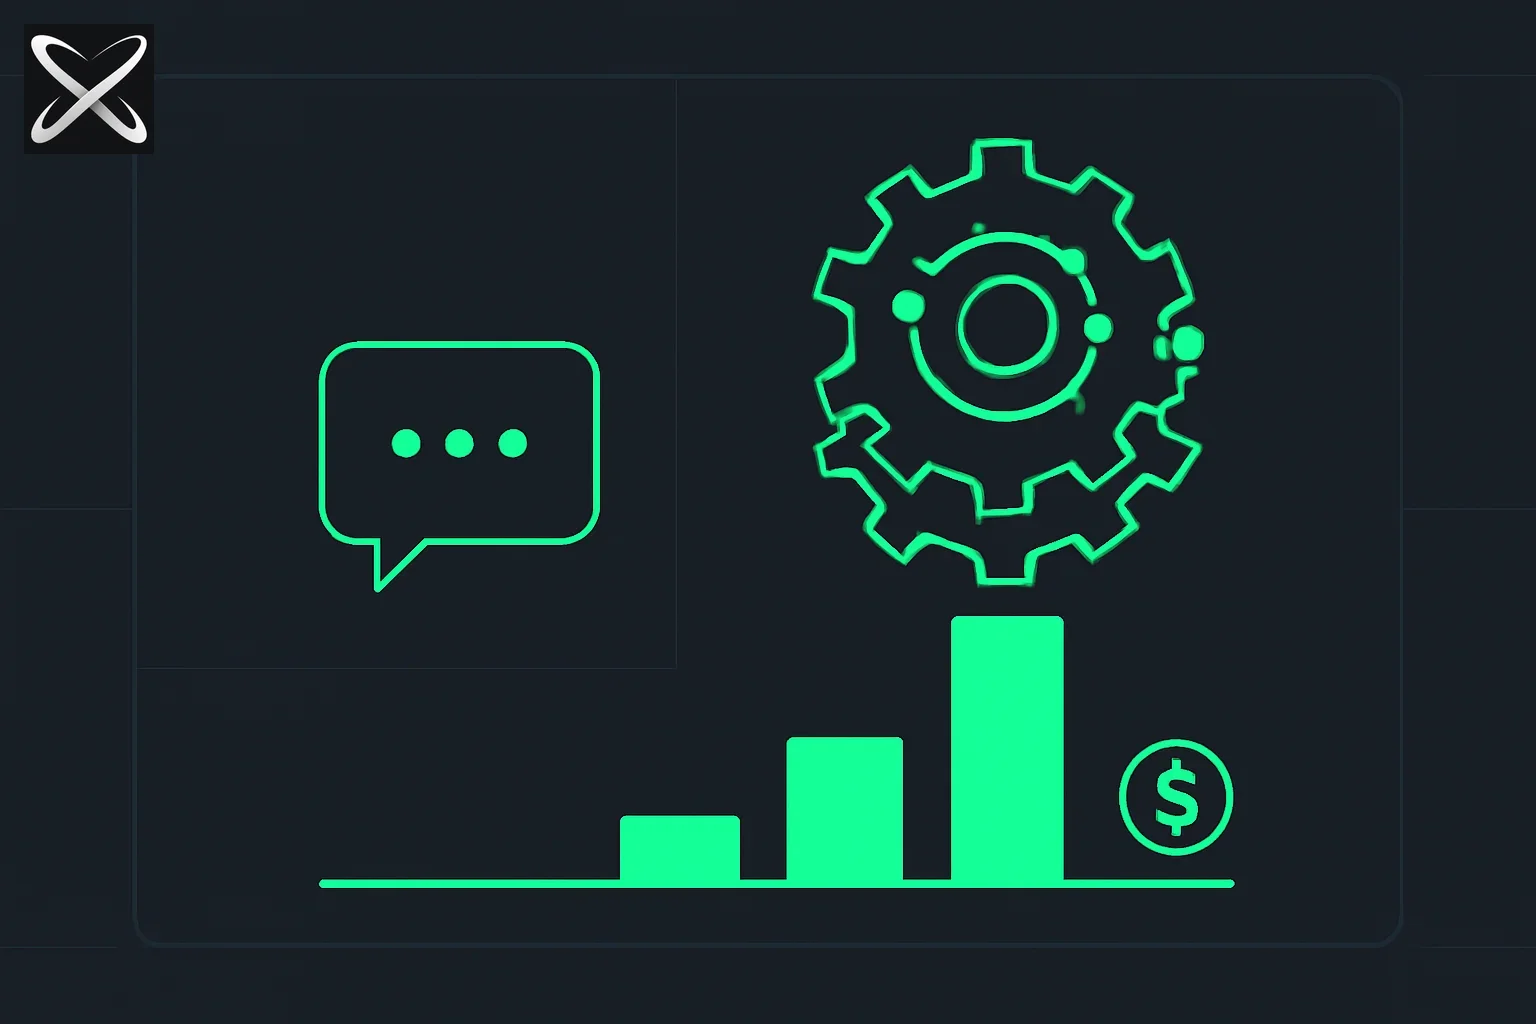 Diagram-style illustration of agent traffic passing a single gateway choke point, symbolizing traces, tokens, and cost collapsing into one debug surface
If you already export OTel v2 to Tempo, Honeycomb, or a vendor preset (Arize, Phoenix, Langfuse OTEL, Weave, SigNoz, and others listed in that doc), Lens is an additional investigation layer on data that still lives with you — not a requirement to rip out the collector.
Minimal proxy flags to start emitting v2 (OTLP HTTP) look like this; this is tracing, not Lens itself:
LITELLM_OTEL_V2=true
OTEL_EXPORTER="otlp_http"
OTEL_ENDPOINT="http://localhost:4318"
Then start the proxy as usual (litellm --config config.yaml). Lens's documented path is still: send those traces to the LiteLLM proxy, run the worker against ClickHouse/Postgres, and investigate there. Do not confuse "OTel v2 is on" with "Lens is analyzing production."
The 200,000-trace figure is a future scenario
Jaffer described Lens as something you would need when agent swarms produce 200,000-plus traces. Launch imagery showed lots of agents, lots of tool calls, each run as a trace with steps, tokens, and dollar cost.
That number is not reported usage. It is not a customer case study. It is not a published benchmark of Lens on a 200k corpus. explainx.ai is stating this in the body, the TL;DR, and the FAQ because aggregators will repeat "200,000 traces" as if someone already ran that volume through the product.
Designing for a future flood is reasonable. Quoting the flood as today's installed base is how launch posts get laundered into fake scale. If your fleet is 80 agents and a few thousand traces a day, Lens might still help you cluster failures. You do not need 200k to justify looking at it. You also should not pretend you have 200k.
Not a hosted Langfuse clone you must send data out to
The observability shelf is already crowded: LangSmith, Langfuse (self-hostable), Phoenix, Braintrust, plus generic APM. LangChain even shipped a chronological agent-session view in LangSmith on September 24, 2026, six days before the Lens post. Naming those products is context. Linking out to them is not this post's job.
LiteLLM's wedge is distribution through the proxy you already pay to operate. You are not being asked to stand up a second vendor and dual-write every span "because observability." You are being asked to treat the gateway as the place traces land, then run investigations next to routing, keys, guardrails, and spend.
That is a different product than a hosted trace UI whose business model is ingest. It is closer to "the load balancer grew a debugger." The honest limitation: if you already self-host Langfuse and your agents speak OTel well, Lens is incremental — another worker and two databases — not a mandatory cutover.
For teams whose agents call tools over MCP, the gateway view matters more, not less. Tool spans are where "the model was fine, the filesystem call hung" lives. A completion log will not show that. A run-level trace might.
Who should try Lens this week
Try the waitlist if all of these are true:
- LiteLLM is already the production model gateway — aliases, virtual keys, spend, fallbacks.
- Agents (coding, ops, support) emit more than a handful of LLM calls per user-visible task.
- Security will not bless exporting full traces to a hosted third party.
- Someone on the platform team can run ClickHouse + Postgres + a worker without turning it into a two-quarter project.
That is the AT&T-shaped reader. You already proved routing and cache-aware model choice. The next pain is why this agent burned $12 and still skipped the runbook, not which SKU is two cents cheaper.
Do not migrate just for Lens if:
- Your router is OpenRouter (Auto Router, BYOK, cascades). OpenRouter's job is marketplace routing and spend controls. Lens does not replace that, and swapping the edge for a self-hosted proxy is a residency and ops decision, not an observability plugin install.
- Your router is OmniRoute on localhost (fallback combos, compression, subscription drain). That stack is local quota stretching. It does not become LiteLLM because a CTO shipped an analyzer.
- You have no OpenTelemetry on the agent yet. Lens cannot invent traces. Instrument first; shop analyzers second.
- You wanted a magic eval product. Write the golden set. Then decide whether Lens, an LLM-as-judge job, or a spreadsheet is the investigation UI.
Practitioner rule: gateway choice is sticky. Observability features should ride the gateway you already trust. They should not force a fork-lift.
What people are asking after the launch thread
Can I point Claude Code at the traces?
The launch pitch says coding agents can query customer-controlled trace data without hosted-platform rate limits. That is an API/SQL access story. It is not "Claude Code is bundled." You still authenticate to your proxy and warehouses. Treat it like giving a coding agent read-only SQL to an internal table — useful, and a data-access review.
Does this replace spend dashboards and iteration budgets?
No. LiteLLM already tracks cost on the LLM span and already has session iteration / budget headers for agent loops. Lens is for behavioral clustering (skipped step, bad tool recovery), not for replacing the invoice. Keep spend alerts where they are.
What if I already export to an OTel backend?
Keep it. OTel v2 is built to be backend-agnostic. Lens is an investigation product on traces the proxy holds. Dual-export is normal. Pick one system as the source of truth for "why did this run fail" so you do not argue across two UIs.
Early access — should I wait?
Yes, if you cannot staff ClickHouse. The announcement did not include GA, pricing, or a published accuracy study of the grouper. Early access is the right label. Pilot on a non-prod agent with known failure modes (forced tool errors) before you trust clusters in an incident channel.
Limitations you should budget for
- Instrumentation tax. No traces in, no Lens out. Distributed
traceparentand session IDs have to be correct or you get a pile of orphan LLM spans. - Judge-model cost. The analyzer calls a model through LiteLLM. Investigation is not free. Cap it the same way you cap any LLM-as-judge job.
- Ops surface. ClickHouse + Postgres + worker is real SRE load. Customer-hosted is a feature and a chore.
- No published scale proof. 200k is a future picture. Clustering quality on your taxonomy is unproven in public.
- Not an eval suite. Grouped failures are hints. Promotion still needs evals engineers and PMs actually run.
- Chokepoint claim is marketing. LiteLLM is widely deployed; "all enterprise AI traffic" is not a measured statistic.
Related on explainx.ai
-
Respan Gateway: an open-source Rust AI gateway built around plugins
-
AT&T cut AI coding costs 56% with model routing — why LiteLLM already sits on production coding traffic
-
OmniRoute: free local AI gateway — stay here if localhost routing is the job; do not migrate for Lens
-
How enterprises use OpenRouter for routing — marketplace routing is a different layer than self-hosted trace analysis
-
What is MCP — tool calls are why run-level traces beat completion logs
-
AI evals for engineers and PMs — Lens groups failures; evals decide what "good" means
-
Loop engineering for coding agents — long runs are exactly the traces you cannot eyeball
Official: Launching LiteLLM Lens (Ishaan Jaffer, Sep 30, 2026) · OpenTelemetry v2. Secondary recap: RuntimeWire on the Lens launch (treat 200k as a future scenario, as that piece also flags).
Lens is early access as of the September 30, 2026 announcement. Proxy flags, OTel v2 env vars, and storage roles above match LiteLLM docs as of October 1, 2026. Confirm waitlist status, GA, and pricing on LiteLLM's own docs before you staff a deployment.