



Google Research and its collaborators have published a Nature study on a model that flags likely high blood pressure from the pulse sensor and motion sensor in an ordinary smartwatch, with no cuff calibration. In a prospective study of 196 people, it caught 65.8% of people with hypertension, against 55.3% for a standard office reading, according to the Google Research blog post dated November 5, 2026. The Decoder covered the result on November 7.
The headline is easy to over-read. This is a smartwatch hypertension detection model, not a cuffless blood pressure meter. It does not report 128 over 82. It estimates how likely it is that a person has persistently high blood pressure, then suggests getting checked. Google says more than half of people with high blood pressure do not know they have it, and that gap is the target.
TL;DR: what Google Research reported
| Question | Answer |
|---|---|
| What is it? | A model named AI-PPG-ACC-HTN that flags likely hypertension from wrist PPG (pulse) and accelerometer (motion) signals |
| Does it need a cuff to calibrate? | No |
| Does it give a blood pressure number? | No. It gives a continuous hypertension probability, averaged over several days of wear |
| Training data | 492,347 hours from 2,109 participants, mostly without labels |
| Validation | Prospective, five US sites, 196 participants, checked against 24-hour ambulatory blood pressure monitoring |
| Initial screening result | Sensitivity 65.8%, specificity 90.0%, positive predictive value 80.6% |
| Office screening comparison | Sensitivity 55.3%, positive predictive value 77.8% |
| Does it replace a diagnosis? | No. The authors call it early feasibility research and opportunistic screening |
| Is it a shipping product? | Unclear. Google says it helped inform a Google Health app feature, and also says it is not indicative of a commercial feature |
How does the model work without a cuff?
Most wearable blood pressure attempts try to predict a number and need a cuff reading to calibrate. Google took a different route and asked a simpler question: does this person have a persistently hypertensive state? That choice matters. A single wrist pulse is noisy, but the average pattern across days of wear is far steadier.
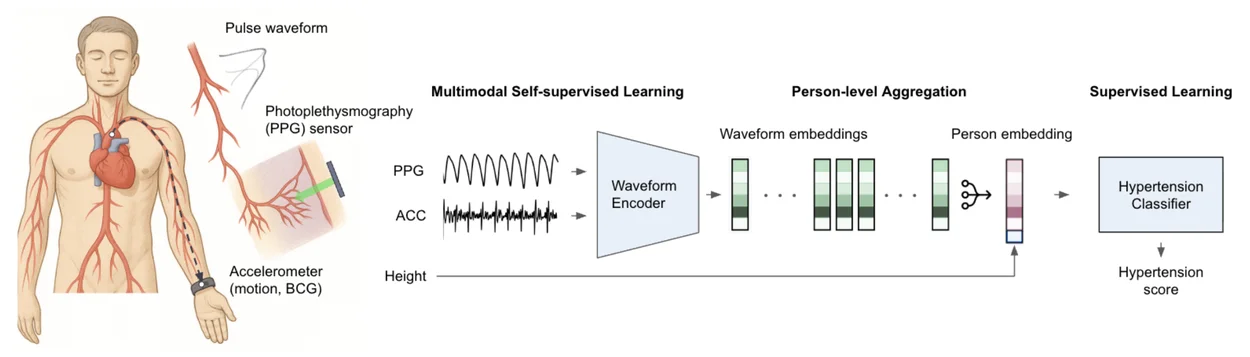 Smartwatch hypertension detection workflow from PPG and accelerometer signals to a hypertension score
Image: Google Research
The pipeline has two stages, according to Google Research.
Stage 1: self-supervised pre-training. A one-dimensional convolutional network learned from unlabeled data. The data covered 492,347 hours from 2,109 participants, cut into overlapping 15-second windows of PPG and accelerometer signal. The network used contrastive learning: it had to work out which short segments came from the same person. No diagnosis labels were needed. To tell people apart, the network had to learn stable features of each person's pulse and heartbeat pattern. This is the same family of ideas behind foundation models for sensor data, where pre-training on a lot of unlabeled signal replaces expensive labeled datasets. Stage 2: person-level classification. The window embeddings are averaged over several days of wear. The averaged embedding and the person's height feed a regularized logistic regression. Height serves as a proxy for arterial path length, which shapes how fast a pulse wave travels. The output is a continuous hypertension probability.
Two sensors carry the signal. The PPG sensor shines light into the skin and reads the pulse waveform. The accelerometer reads the small recoil of the body with each heartbeat, called the ballistocardiogram. Both already ship in mainstream watches, which is why no new hardware is needed.
What did the study show?
The validation study was prospective and multi-center, at five US sites, with 196 participants. Participants had no known cardiovascular disease and were not on blood pressure medication. The reference standard was 24-hour ambulatory blood pressure monitoring, which is a stricter yardstick than a single clinic reading.
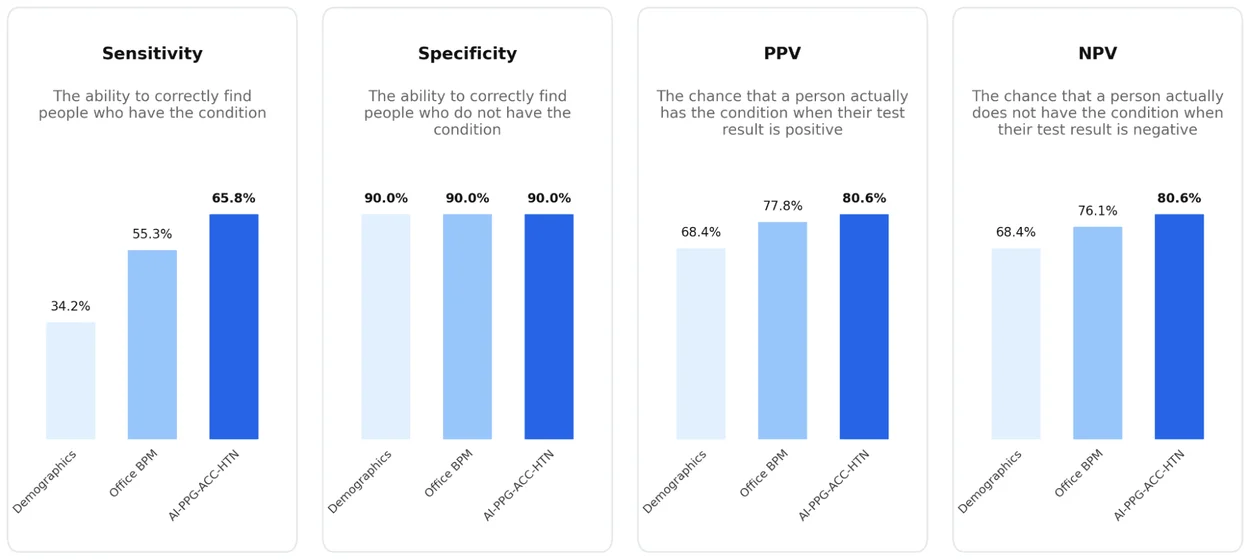 Bar charts of sensitivity, specificity and PPV for the smartwatch hypertension model versus office blood pressure
Image: Google Research
| Setting | Method | Sensitivity | Specificity | PPV |
|---|---|---|---|---|
| Initial screening (N=196) | Smartwatch model | 65.8% | 90.0% | 80.6% |
| Initial screening (N=196) | Office blood pressure | 55.3% | not stated in the post | 77.8% |
| Confirmatory testing (N=48) | Smartwatch model | 78.4% | 90.9% | 96.7% |
| Confirmatory testing (N=48) | Repeat office blood pressure | 67.6% | 63.6% | 86.2% |
| Confirmatory testing (N=48) | Multi-day home monitoring | 89.2% | 81.8% | 94.3% |
All figures come from the Google Research post. Negative predictive values appear only in its charts, so we do not quote them.
The authors summarize the watch as performing comparably to traditional cuff-based workflows. That is a fair reading of the screening row: the model beat a single office reading on sensitivity and was close on positive predictive value. But the table also shows a limit that is easy to miss. In the confirmatory subset of 48 people with elevated office readings, multi-day home monitoring still had the highest sensitivity at 89.2%, ahead of the watch at 78.4%. The watch's edge in that subset is specificity: 90.9% against 63.6% for a repeat office reading.
What do 65.8% sensitivity and 90% specificity mean in practice?
Sensitivity is the share of people with the condition that the test catches. At 65.8%, roughly one in three hypertensive people in the study would not have been flagged. A watch that stays silent is therefore not a clean bill of health.
Specificity is the share of healthy people the test correctly clears. At 90.0%, about one in ten people without hypertension would get a false flag. In a screening setting, a false flag usually costs a clinic visit and a proper measurement, which is a small price. A missed case costs more, since untreated hypertension is silent for years.
That asymmetry explains how Google framed the goal: opportunistic screening that nudges people toward a clinic. A passive watch has one real advantage over every other test. It collects data without asking the wearer to do anything. A cuff only works if someone remembers to use it. A watch is already on the wrist for days.
What did the model learn to look at?
Google Research reports an interpretability analysis. Waveforms linked to higher risk showed a slightly narrower pulse width, which may suggest stiffer arteries. They also showed a slower systolic upstroke and a lower d/a ratio, a feature tied to pulse wave reflection. In the ballistocardiogram, higher-risk signals showed deeper K waves and wider IJK complexes.
These patterns match physiology that clinicians already associate with arterial stiffness, which is reassuring. It suggests the model is not latching onto an accident of the dataset. It is not proof, though. The authors present these as exploratory findings.
What are the limits Google itself lists?
Google Research is direct about the caveats, and they deserve the same weight as the headline.
- Early feasibility work. The authors describe the methods as exploratory.
- Moderate sensitivity. Many hypertensive people would be missed in both settings.
- Small confirmatory subset. Only 48 people.
- Modest cohort. 196 participants, with a general demographic description only.
- No external validation described beyond the study itself.
- Narrow population. People with known cardiovascular disease or on blood pressure medication were not part of the validation.
- Not a standalone diagnosis. It is not meant to replace arm cuffs.
There is also a product caveat. The post says the research helped inform the blood pressure trends feature in the Google Health app, but it gives no details on availability, regions or regulatory status. It adds that the described methods are not indicative of any existing or upcoming commercial product feature. The Decoder says the findings were "folded into" the blood pressure trends feature in the app. Google's own wording is more careful, and we follow it. If you want to know what your watch does, read the feature's help page, not the headline.
How does this compare with Google's other health AI work?
This study sits in a run of Google Research health papers that try to turn consumer sensors into screening tools.
- Google's passive heart-rate work with a phone camera used the camera instead of a wrist sensor.
- GlucoFM applied a foundation-model approach to continuous glucose monitor data.
- Blind-sweep ultrasound AI let novice operators estimate gestational age.
- The Fitbit Air tracker shows the hardware side of the same push toward always-on, screenless sensing.
The common thread is a modest claim, validated against a real reference, aimed at getting people to care sooner. That is a more credible pitch than the "cuffless blood pressure" headlines that wearables have produced for a decade. For a counterpoint on how fast medical AI claims can outrun evidence, see our coverage of the Microsoft diagnostic orchestrator claims and the Biograph coronary inflammation claim.
Why the pre-training trick matters for builders
The most reusable idea in the paper is not blood pressure. It is the recipe. Labeled medical data is scarce and slow to collect, since each label needs a 24-hour ambulatory monitor and a clinician. Unlabeled wearable data is abundant. Google used the abundant data to learn a general representation of a person's cardiovascular signal, then used a small labeled set to train a light classifier on top.
 Funnel sorting many health signals into a short list for screening
That split has three practical consequences:
- Small heads, big encoders. The final classifier is a regularized logistic regression, which is cheap to train, easy to audit and easy to recalibrate for a new population.
- Personalization for free. Because the encoder learned what makes one person different from another, averaging over days reduces noise from a person's own quirks.
- A template for other conditions. The same pre-trained encoder could, in principle, feed classifiers for other conditions. The paper does not claim this, and we do not either, but the design invites it.
Developers working with sensor streams can borrow the pattern: pre-train with a contrastive objective on unlabeled windows, aggregate embeddings over a person-level horizon, then fit a simple head.
What should you do with this today?
- Do not stop cuff checks. If repeat cuff readings run high, talk to a clinician. The study's own data shows multi-day home monitoring is strong.
- Treat a watch alert as a nudge. A flag means "get measured", not "you have hypertension". A silent watch does not mean you are fine.
- Check the claim on your device. Look for the blood pressure trends feature in your Google Health app and read the help page for regional availability and any disclaimers.
- If you have risk factors, ask for a clinic measurement even with no alert. The model's 65.8% sensitivity means silence is weak evidence.
- Ask who was in the study. People on blood pressure medication or with known heart disease were not in the validation. Results may not carry over to you.
The bottom line
Google Research has shown, in a peer-reviewed Nature paper, that passive smartwatch signals carry real information about hypertension, with a screening result that beat a single office reading on sensitivity. It has also been candid that the result is early, moderate in sensitivity, and not a diagnosis. The sensible reading is "promising screening aid", not "cuff replacement". We will update this post if Google clarifies how, or whether, this exact model ships in a product.
Related reading
- Google passive heart-rate monitoring with a phone camera
- GlucoFM: a foundation model for glucose monitor data
- Google blind-sweep ultrasound AI
- Google Fitbit Air screenless tracker
- Microsoft diagnostic orchestrator: claimed vs verified
- Biograph coronary inflammation AI: claimed vs verified
- OpenEvidence Darwin medical AI
- Sources: Google Research blog, Nature paper
Figures and study details are accurate as of November 7, 2026, and come from Google Research's blog post and the linked Nature paper.