Stanford MemoryDAX: 65 Years of DRAM, HBM, and NAND Flash Prices — What the Data Actually Shows
Stanford released an interactive dataset tracking DRAM, HBM, and NAND flash prices from 1960 to 2026. Here is what the charts reveal about AI demand, the memory super-cycle, and HBM pricing inside your GPU.
AI InfrastructureMemory PricingDRAMHBMHardwareAI Compute
In June 2026, Stanford University's MemoryDAX project published an interactive dataset tracking semiconductor memory prices across six decades. The post hit Hacker News with 230 points and 85 comments within hours — not because the data was new, but because the charts make viscerally clear something that raw numbers obscure: the longest continuous price decline in industrial history appears to have paused, reversed, and entered a new regime.
The charts cover three separate stories: DRAM's long fall and recent plateau, NAND flash's continued decline, and HBM's entirely different structure as a product sold only on confidential contracts. Together they describe the memory economy that AI infrastructure runs on.
What the Dataset Is and Where It Comes From
MemoryDAX is an explicit continuation of John C. McCallum's classic memory-price dataset, which tracked retail DRAM and storage prices from 1957 until McCallum's website went dark. Stanford found the data dump on the Internet Archive and extended it, adding:
DRAM post-2024: Keepa Amazon price tracking (cheapest listed retail price in nominal USD)
NAND flash: Keepa's cheapest consumer NVMe prices from 2016 forward
HBM: Sparse analyst estimates from TrendForce and SemiAnalysis (no public spot market exists)
Accelerator cost breakdown: Modeled estimates from Epoch AI, covering Nvidia, AMD, Google (TPU), and Amazon (Trainium)
The methodology note is important for anyone citing the numbers: these are nominal USD lowest retail prices, not contract prices, averages, or inflation-adjusted figures. HBM numbers are analyst estimates, not confirmed transaction prices. The dataset is downloadable as CSV.
Chart 1: Price per Gigabyte — The 65-Year Arc
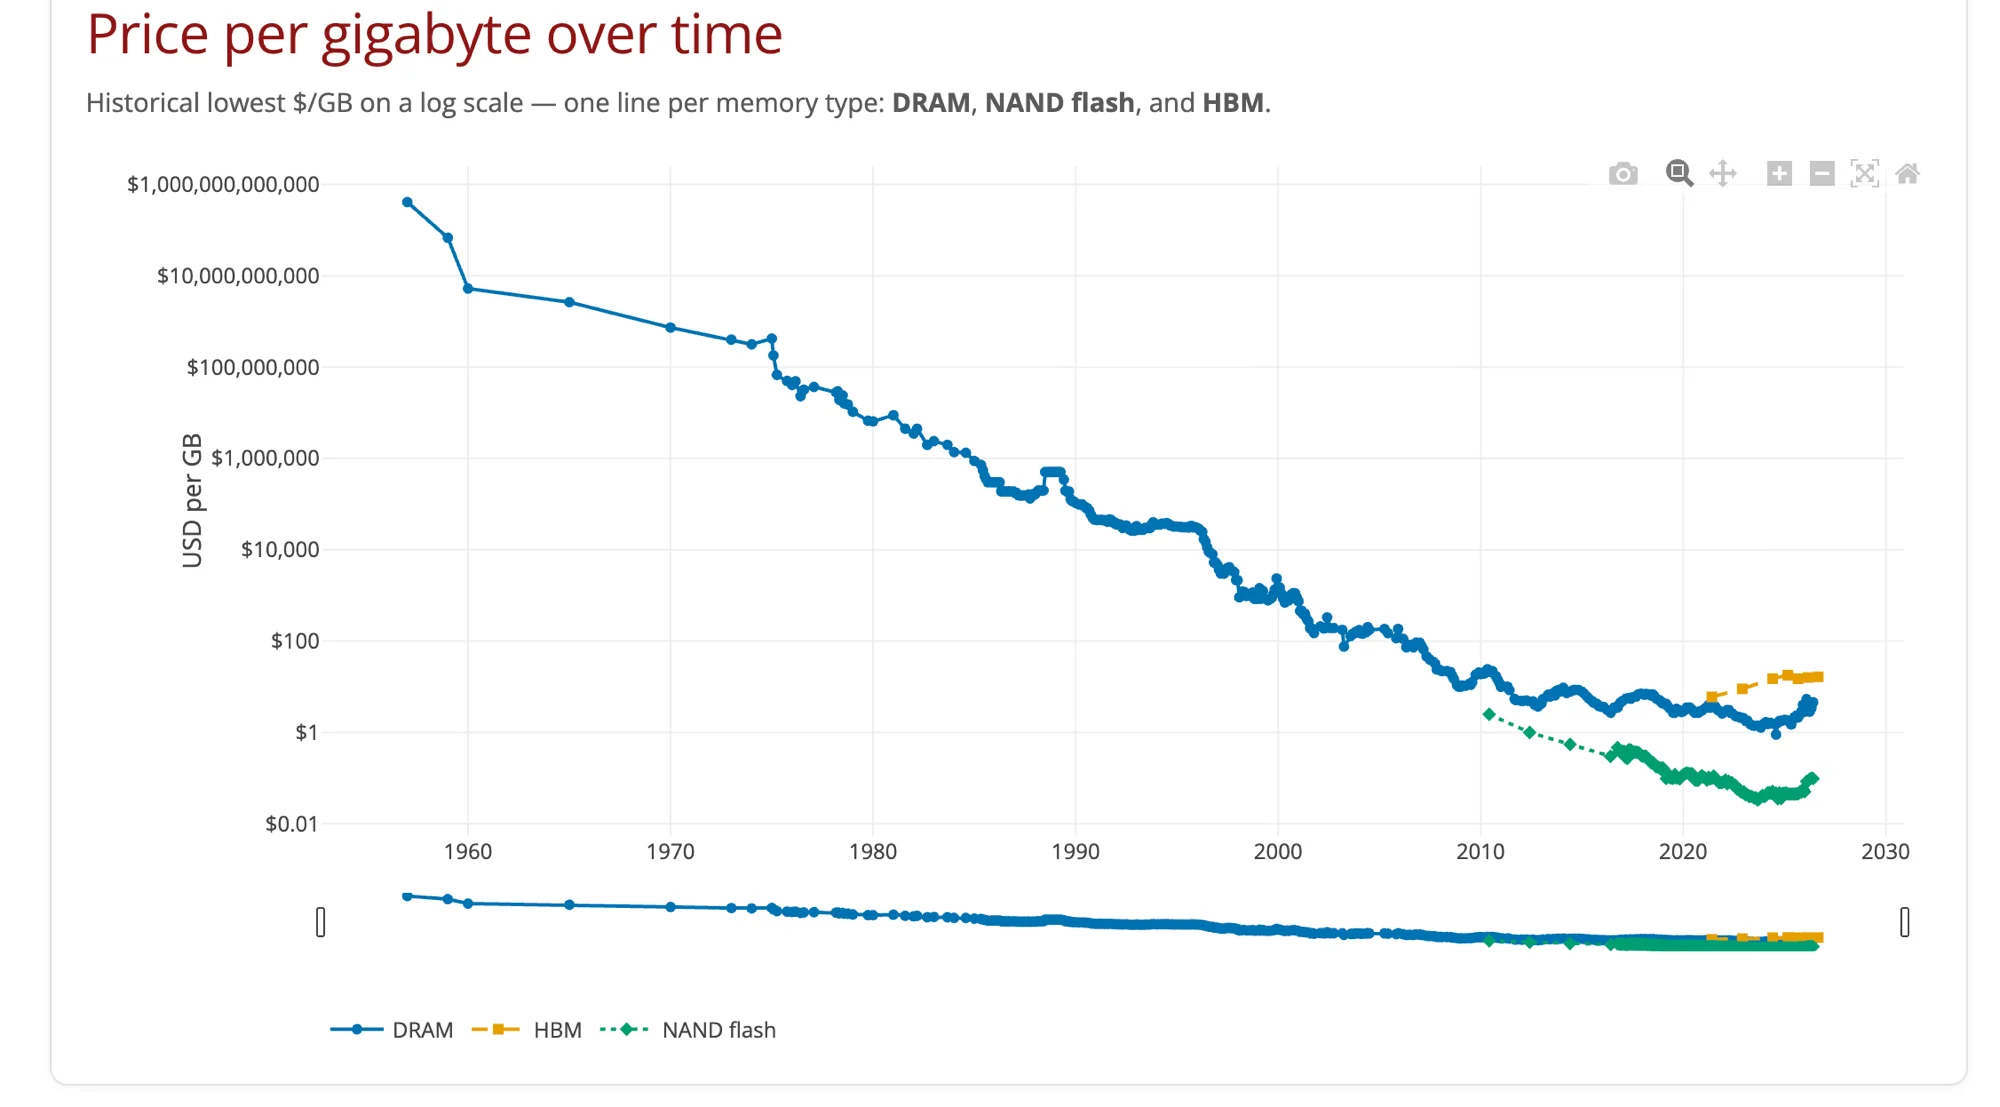
The headline chart plots DRAM, HBM, and NAND flash on a log scale from 1960 to 2026. The DRAM line is the one worth studying.
From , DRAM price per gigabyte fell at a rate of roughly — from around $10 million/GB to around $10/GB. This is the Moore's Law era of memory: each new process node packed more cells per die, each new generation drove prices lower at a near-constant exponential rate.
From 2009 to 2020, the slope flattened to roughly one-third the previous rate — one order of magnitude per 15 years instead of two per decade. This matches the end of easy Dennard scaling in CPUs: the physics of packing more transistors into the same area and keeping them cool became progressively harder and more expensive.
From 2020 onward, and particularly from 2023, the line does something it has not done since the mid-1980s: it goes up. DRAM price per gigabyte has increased and stabilized at levels last seen around 2010–2012.
The HN commenter who noted "we just rolled back to 2010" is nominally correct for DDR5 compared to DDR3 prices from that era — though inflation-adjusted, prices are still modestly lower. The psychologically significant point is that 65 years of directional decline appears to have ended.
Why DRAM Prices Stopped Falling
The flattening of the DRAM price curve reflects two forces that compounded:
Technical friction. Moving from DDR4 to DDR5 did not deliver the die-cost reductions that previous generational transitions did. Sub-10nm DRAM cell scaling is approaching physical limits on capacitor charge retention. Each new generation requires more expensive manufacturing steps without proportional increases in bits per die.
AI demand absorption. This is the newer force. Samsung, SK Hynix, and Micron collectively produce the world's DRAM supply. Beginning in 2023, AI data center demand — primarily from Nvidia H100 and H200 systems consuming HBM, but also from server DRAM for inference workloads — absorbed a growing fraction of manufacturing output. As the mobile DRAM price surge of Q2 2026 documented, manufacturers redirected roughly 70% of DRAM output to AI server customers, compressing supply to smartphone and PC markets and driving LPDDR5X prices up 78–83%.
Chart 2: DRAM Price by Generation
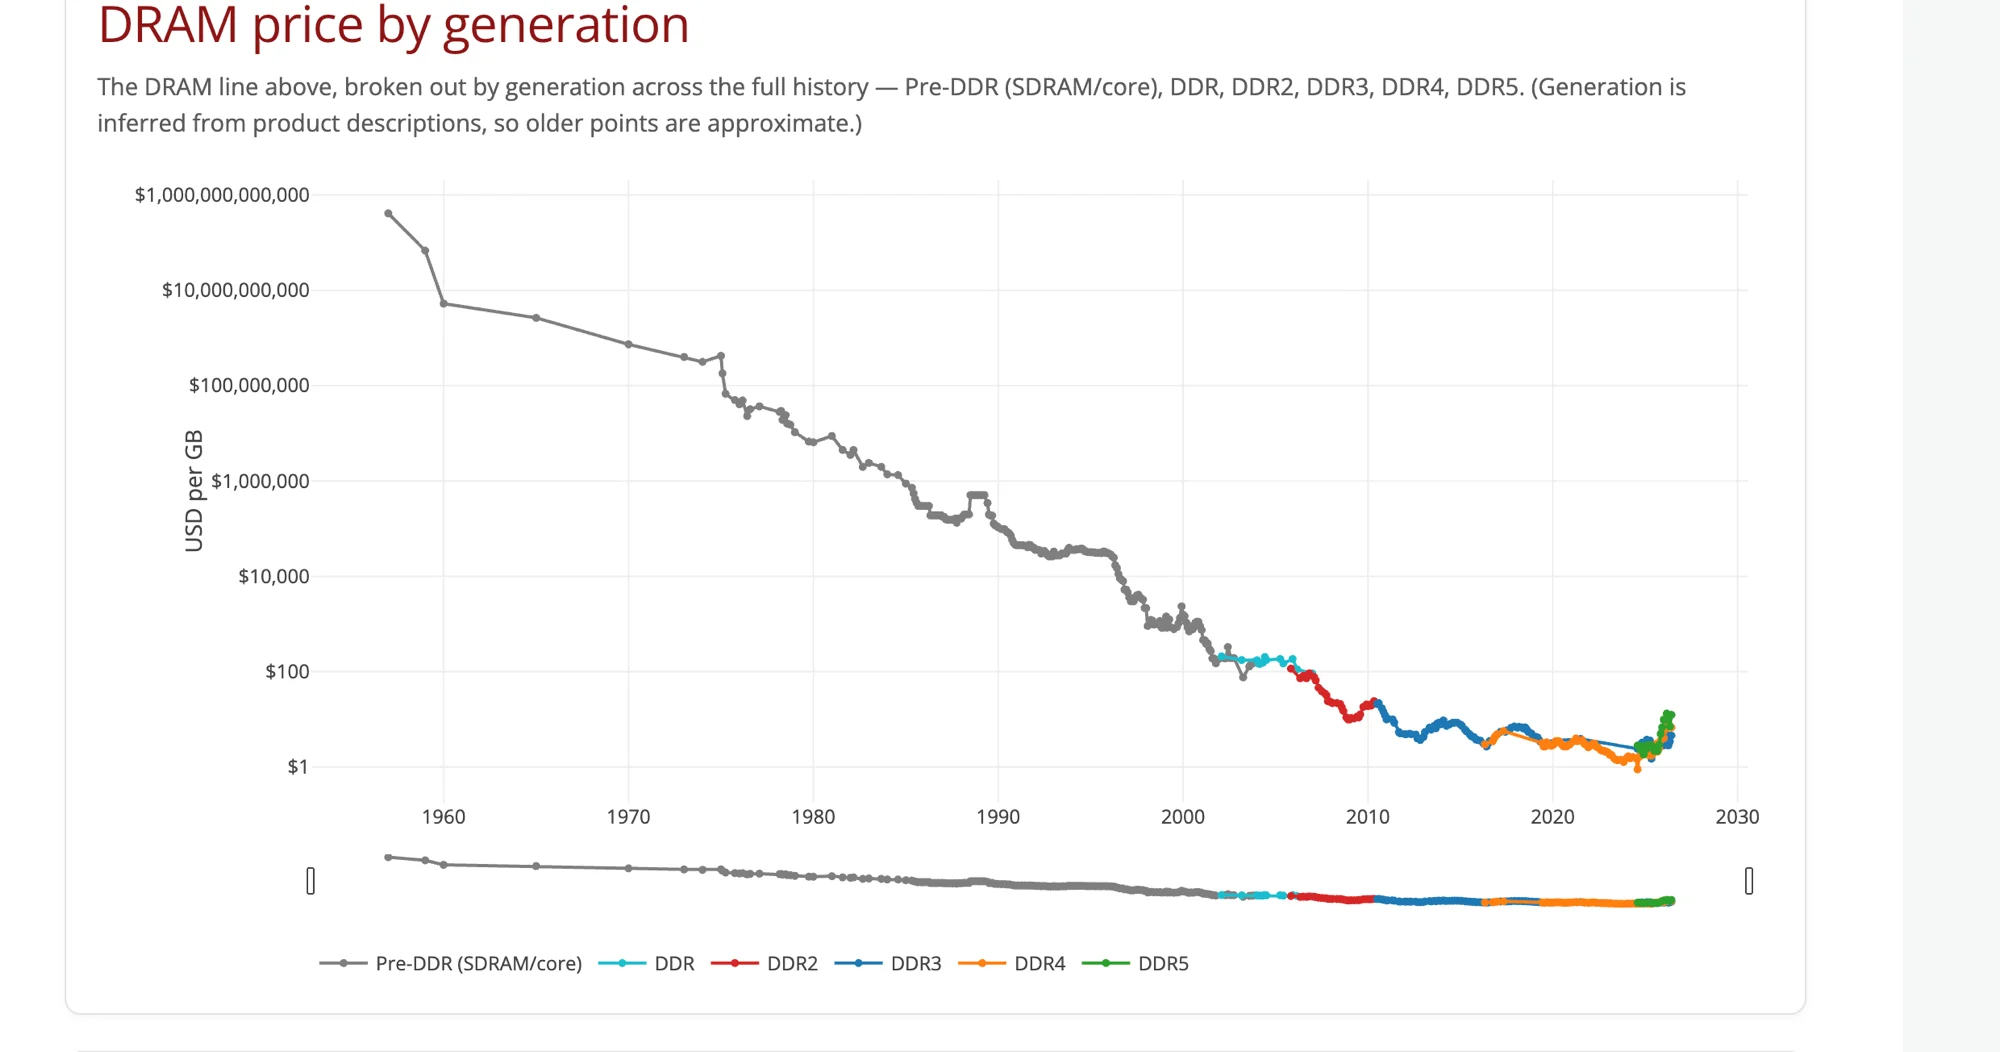
Breaking the DRAM line out by generation (Pre-DDR, DDR, DDR2, DDR3, DDR4, DDR5) shows the familiar staircase pattern: each new generation launches at a premium, then declines sharply as yield improves and volume ramps, before plateauing near the price at which the next generation launches.
The notable anomaly visible in the data: DDR4 and DDR5 price lines are now overlapping, with DDR5 in some configurations matching DDR4 pricing per GB. This is unusual — normally a new generation launches at a significant premium. The convergence reflects both the DDR4 supply glut from memory companies' overproduction in 2022–2023 and the slower cost reduction curve of DDR5 manufacturing.
The historical price-fixing era (late 1990s / early 2000s, referenced by HN commenters noting the 1990s crash and the subsequent DRAM cartel) is visible as a sharp floor in DDR and DDR2 era pricing. The three major manufacturers — Samsung, SK Hynix, Micron — were fined a combined $700M+ in the US following the DOJ investigation. Prices crashed when the cartel was broken up.
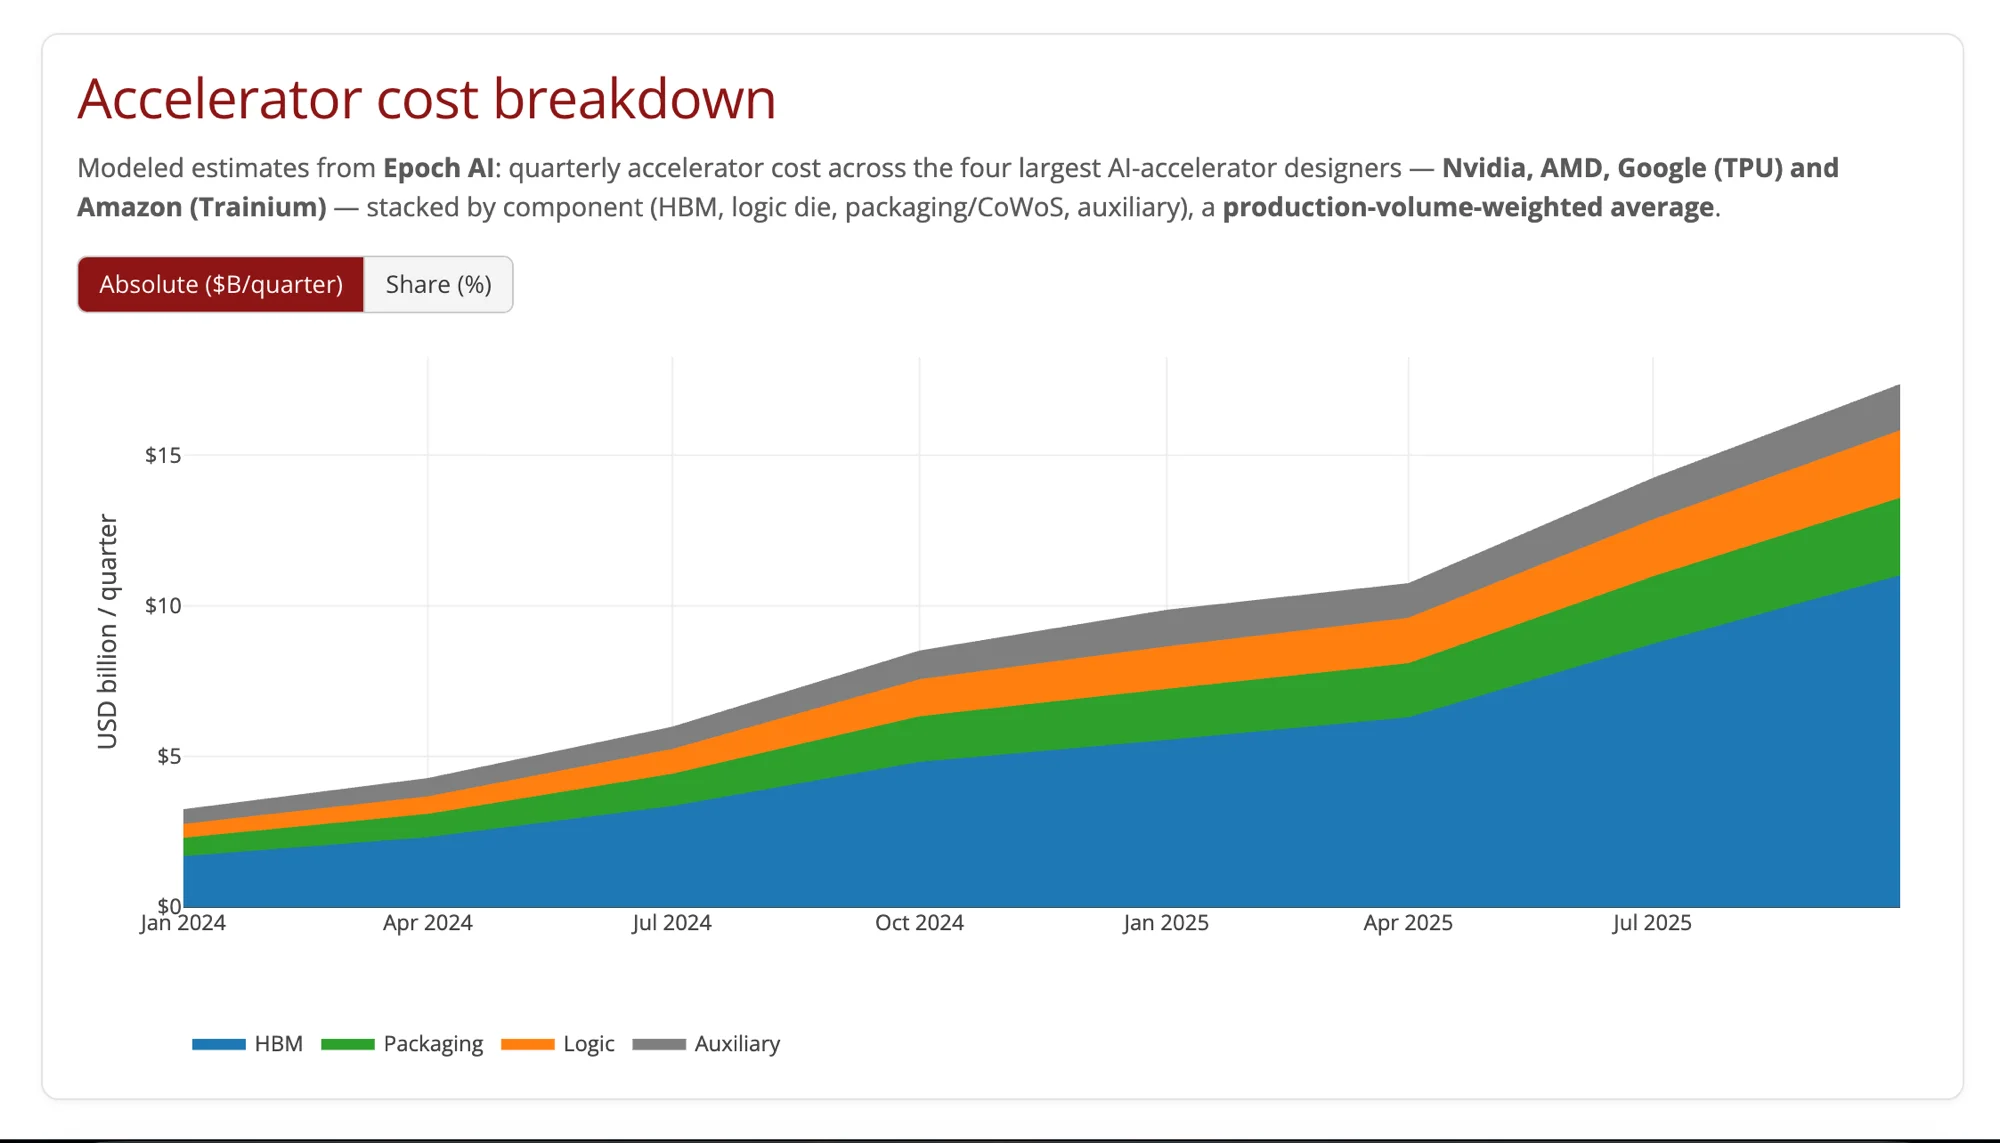
The most practically significant chart in the dataset is the accelerator cost breakdown, modeled by Epoch AI across Nvidia, AMD, Google TPU, and Amazon Trainium, from Q1 2024 through mid-2025.
The stacked area chart shows four cost components per quarter: HBM, logic die, packaging/CoWoS, and auxiliary. The trend is unambiguous: total accelerator cost has grown from roughly $2.5B/quarter in early 2024 to approximately $16–17B/quarter by mid-2025. And the HBM share — the blue band at the bottom of the stack — dominates.
Epoch AI's modeling puts HBM at roughly 65–70% of total accelerator cost in recent quarters. On an H100 where the full chip assembly costs around $30,000–$35,000, this implies HBM stacks account for $20,000–$24,000 of that figure — more than the logic die (the GPU chip itself), more than CoWoS packaging, more than all auxiliary components combined.
This is a structural inversion from earlier GPU generations. A decade ago, the logic die — the GPU chip — was the expensive component. Memory was a commodity add-on. The AI era has reversed this: HBM has become the scarce, high-margin input, and Nvidia's H-series pricing reflects that.
Chart 4: HBM Price by Generation
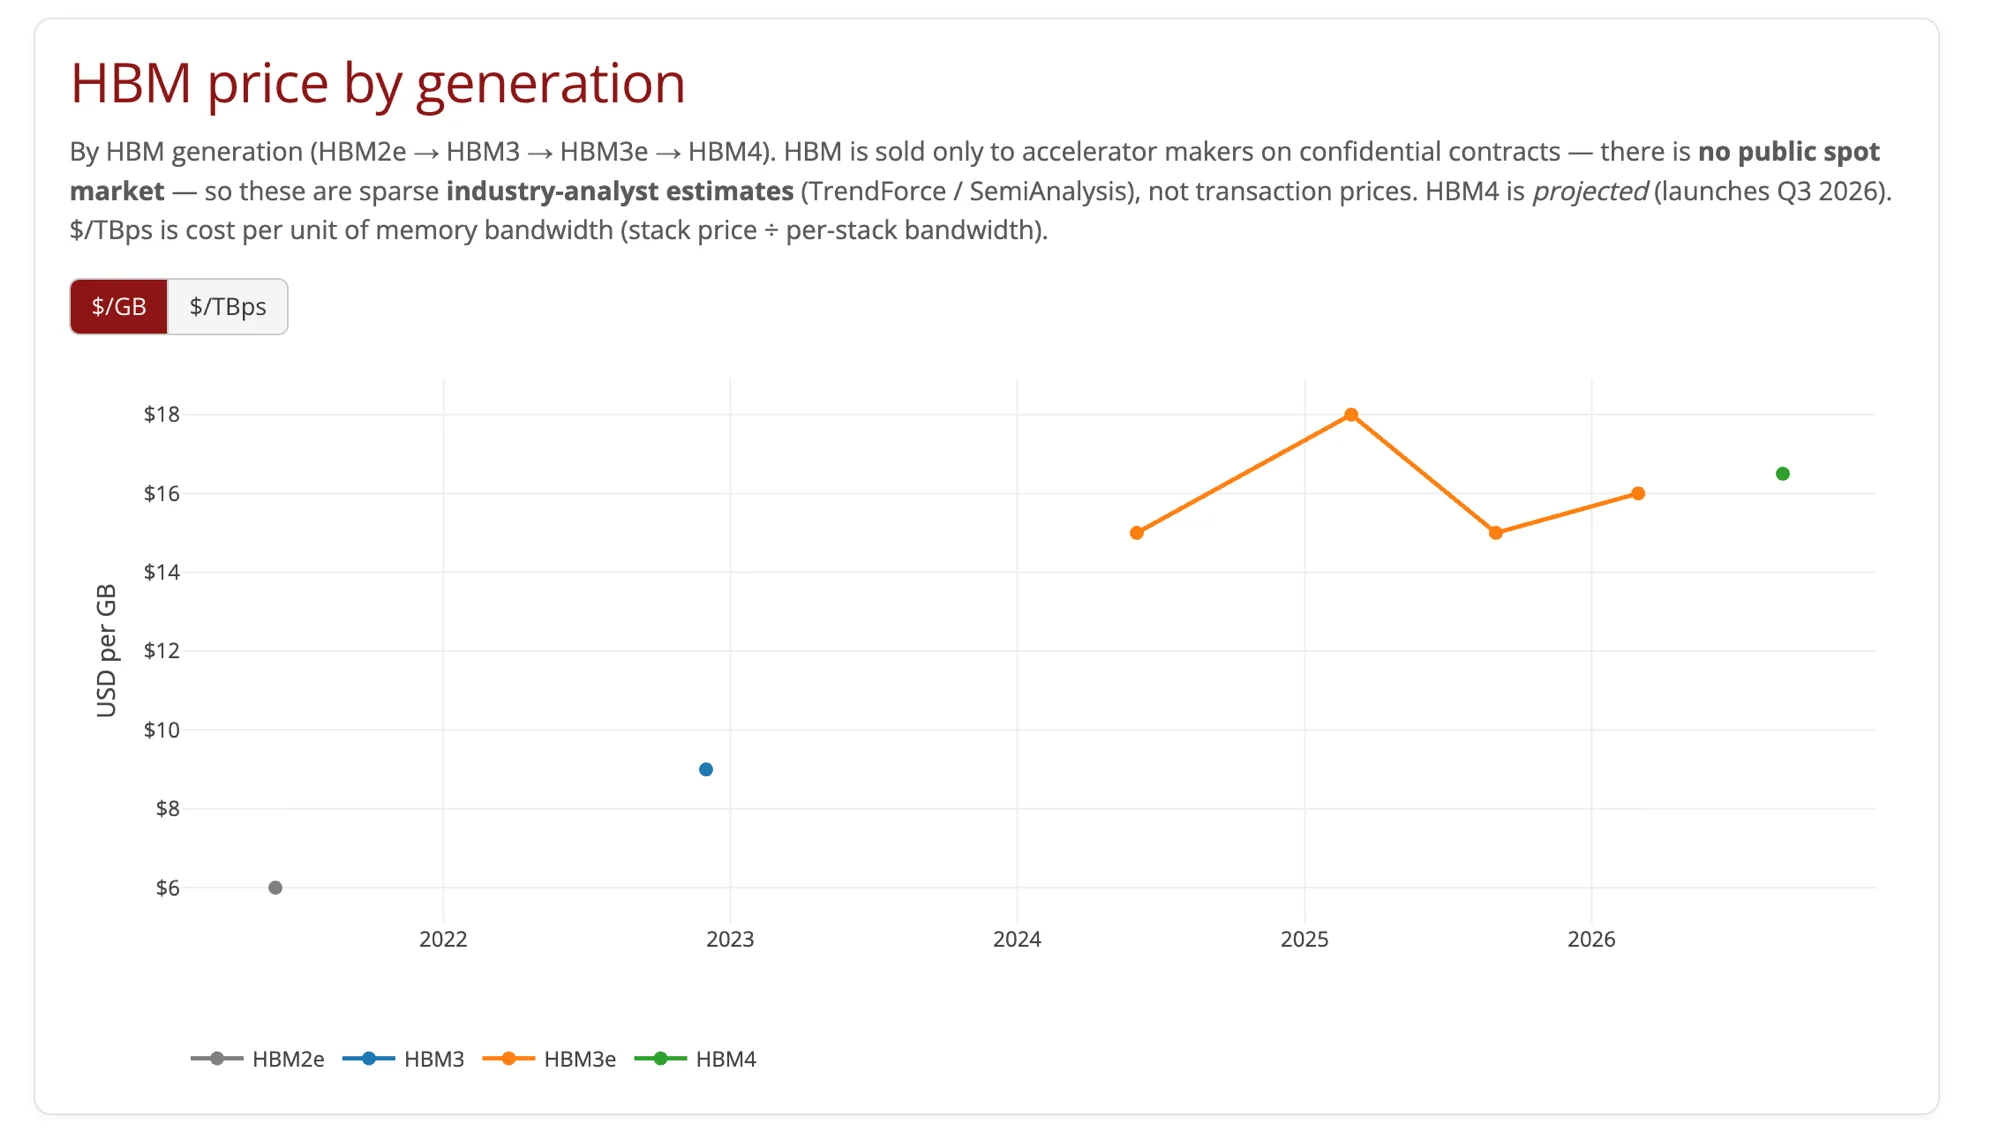
The HBM chart is sparse — intentionally. HBM is sold exclusively to accelerator makers (Nvidia, AMD, Google, Amazon, Microsoft) on confidential long-term contracts. There is no public spot market. Every data point on this chart is an analyst estimate from TrendForce or SemiAnalysis, not a confirmed transaction price.
The $/TBps metric — cost per terabyte per second of memory bandwidth — is arguably more informative than $/GB for AI workloads. HBM3e delivers roughly 1.2 TB/s per stack. At $18/GB and 16GB per stack, that is ~$288/stack for ~1.2 TB/s, or roughly $240/TBps. A standard DDR5 module delivers 64–96 GB/s per channel at far lower $/GB but at orders of magnitude worse $/TBps for bandwidth-limited workloads.
The HBM4 projected price at $16/GB (if accurate) would represent a modest per-GB decrease while delivering substantially higher bandwidth — the same $/TBps compression dynamic that made each DDR generation economically viable for a while.
The Cyclical Pattern and What It Implies
Several HN commenters on the Stanford dataset noted the obvious repeating price cycles in the DRAM history — sharp build-ups followed by crashes. These cycles reflect the capital-intensive structure of memory manufacturing: fab construction takes 2–3 years, so supply responses to price signals are delayed. When prices are high, everyone builds; when the new capacity comes online simultaneously, prices crash.
The current cycle differs from prior ones in one respect: demand is less cyclical than usual. Prior cycles were driven by consumer electronics and PC demand — volatile markets that could swing from shortage to glut in 12 months. AI infrastructure buildout is driven by hyperscaler capex commitments that are planned 2–3 years out and are relatively sticky. Microsoft, Google, Meta, and Amazon have publicly committed to $300B+ in combined capex in 2025–2026, the majority of which includes memory-intensive AI accelerators.
This does not mean prices will stay elevated indefinitely. New CoWoS packaging capacity from TSMC is being built; Samsung's HBM4 yield improvements will matter; and if AI investment cycles down, the supply-demand balance can shift quickly. But the floor for when relief arrives — estimated by analysts and echoed in the HN thread — is 2028 at the earliest for meaningful normalization.
What This Means for AI Infrastructure Planning
For engineers and companies planning AI infrastructure, the memory price picture has practical implications:
HBM scarcity will persist. The 65–70% share of accelerator cost going to HBM is not a temporary anomaly. It reflects fundamental bandwidth requirements for transformer-based LLMs, which are often memory-bandwidth-limited during inference. Until a different memory architecture (CXL pooling, processing-in-memory, or optical interconnects) enters the picture, HBM pricing power remains with SK Hynix and Samsung.
DRAM optimization matters again. The era when server DRAM was a rounding error in infrastructure budgets ended in 2023. Teams running inference infrastructure for LLMs at scale are doing things that would have seemed premature two years ago: quantizing KV caches to reduce memory footprint, tiering to NVMe for long-context batch jobs, and architecting around memory-per-GPU ceilings.
The accelerator cost breakdown shifts the ROI math. If 65–70% of accelerator cost is memory, then innovations that reduce memory requirements — smaller models, better quantization, speculative decoding, MoE architectures — have outsized economic value. This partly explains why China's AI playbook of free models with cheap compute is structurally constrained: HBM is where the cost actually lives, and China's access to advanced HBM generations is export-controlled.
The Historical Perspective
The Stanford dataset is, at its core, a visualization of one of the most sustained cost-reduction curves in industrial history. DRAM in 1957 cost more per bit than some estimates of the per-atom cost of physical materials. In 2020, you could buy a gigabyte of DRAM for less than a cup of coffee.
That trajectory is the foundation of modern computing. Every abstraction layer — operating systems, virtual machines, browsers, language runtimes, AI models — was built with the assumption that memory would keep getting cheaper. When that assumption breaks, it sends reverberations through everything above it.
The 2024–2026 AI demand spike is the first time in the dataset's 65-year history that demand growth has outrun supply growth at the current technology node. It may be transient. It may be structural. The Stanford dataset is an unusually clean tool for watching which way it resolves.
Prices are nominal USD unless noted. HBM figures are industry-analyst estimates, not confirmed transaction prices. The memory market is evolving rapidly; specific figures may have changed since publication.