




Elon Musk posted a hockey-stick bar chart with no y-axis and the caption “AI is a supersonic tsunami.” Within hours it had millions of views — and a pile of replies asking the obvious question: then why doesn’t AI label the axes?
That is the right instinct. The chart is effective propaganda about acceleration. It is not a scientific figure. This explainx.ai post unpacks what the image communicates, what it deliberately omits, and how to hold “tsunami” rhetoric next to measurable progress — including Musk’s own open vs frontier quality clash with Jason Calacanis the same news cycle.
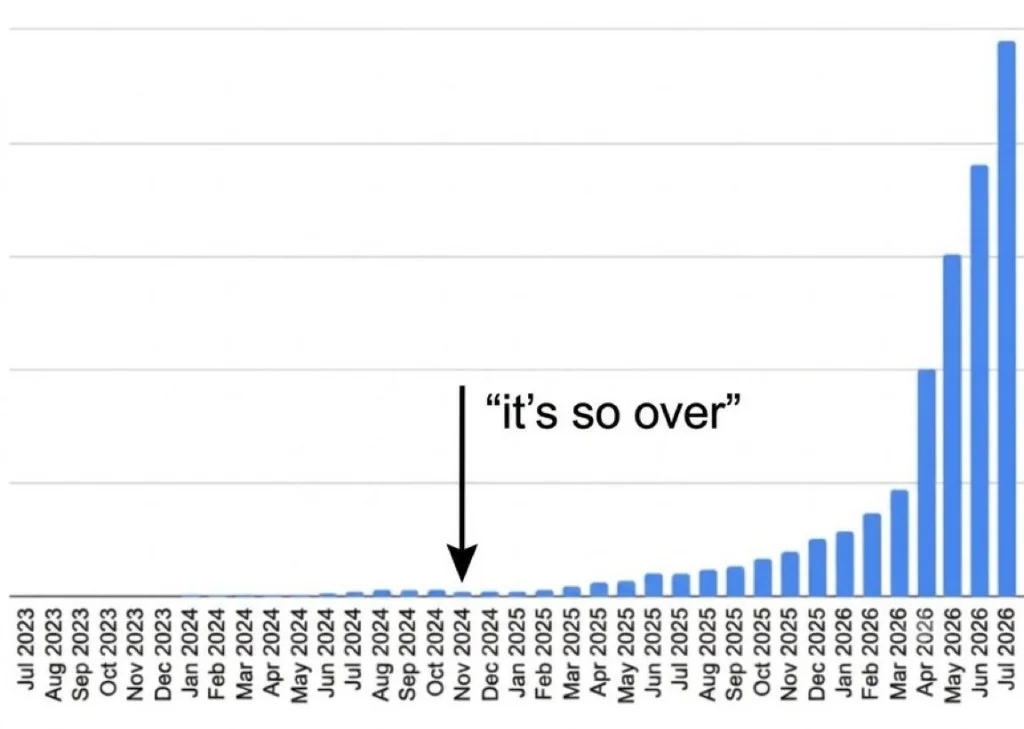 Elon Musk’s unlabeled blue bar chart from Jul 2023 to Jul 2026 with “it’s so over” marked near late 2024 and a steep 2026 rise
Musk’s Aug 3, 2026 chart: flat early bars, “it’s so over” callout, then a vertical 2026 climb — y-axis unspecified.
TL;DR — questions after the post
| Question | Direct answer |
|---|---|
| Claim? | AI progress is accelerating like a “supersonic tsunami” |
| Evidence in-image? | Shape only — no units, no source, no method |
| Meme beat? | “it’s so over” in late 2024 → wrong; 2025–26 “goes vertical” |
| Useful read? | Acceleration narrative for SpaceXAI / xAI-era messaging |
| Builder action? | Keep labeled dashboards; ignore unlabeled hockey sticks for budgets |
| Related explainx.ai? | Singularity explainer, space vs local tokens |
What the chart shows (visually)
Timeline on the x-axis from about July 2023 to July 2026. Blue bars stay tiny through much of 2023–2024. A black arrow marks a late-2024 bar with the text “it’s so over.” Bars then rise through 2025 and explode in height across early–mid 2026, with July 2026 the tallest.
That silhouette is the entire argument: people thought it was over; it was the calm before the wall of water.
Replies treated the missing label as the joke — “assume it’s a measure of your shitposts,” “fixed it again” with parody axes. The dunks are fair. In any serious briefing, an unlabeled dependent variable is a non-starter. In meme warfare, opacity is a feature: every audience projects their favorite metric onto the spike.
Rhetoric vs measurement (four things the chart cannot mean yet)
Until Musk (or someone else) publishes the series definition, the chart cannot rigorously mean any of:
- Frontier benchmark scores — those move in jumps and plateaus, not a clean monthly exponential for every suite (benchmarks guide).
- Useful agent autonomy — harness quality, eval contamination, and silent failures dominate (loop/harness stack).
- Economic surplus — token prices falling and usage exploding can both be true while margins and reliability lag (token economics).
- Safety readiness — capability curves and governance curves are not the same plot (Pacing the Frontier).
It can loosely gesture at training compute, inference tokens, model release cadence, capital expenditure, or vibes-based capability. Those series really do look hockey-stick-ish on some windows. The honest move is to say which one — Musk did not.
“It’s so over” as a narrative weapon
Tech Twitter uses “it’s so over” / “we’re so back” as seasonal mood music. Planting that phrase on a late-2024 bar rewrites recent memory: anyone who said progress stalled becomes the punchline of 2026’s vertical bars.
Historically, late 2024–2025 did include fatigue narratives (productization grind, eval saturation complaints, “where’s GPT-next”). 2025–2026 then delivered dense open-weight and frontier drops — Kimi K3, Inkling / Inkling-Small, DeepSeek-class APIs, agent harness wars. A chart that goes vertical in 2026 fits that feeling even if the y-axis is blank.
The risk: treating a mood rewrite as a forecast. Tsunamis in nature have physics. “Supersonic tsunami” is metaphor stacked on metaphor — speed and inundation — without a waterline for “society is underwater.”
Same week, two Musk messages
Hold this post next to two other Musk threads explainx.ai already covers:
| Thread | Claim | Tension |
|---|---|---|
| Open vs frontier with Calacanis | Still a world of difference on hard tasks | Gap remains on the tail |
| Space compute vs local tokens | Most compute stays server-side, then space | Infrastructure is the bottleneck |
| Supersonic tsunami chart | Aggregate AI is exploding | Acceleration is overwhelming |
These are compatible if you separate layers:
- Aggregate capability / spend / tokens → tsunami-shaped.
- Hard-task reliability open vs closed → still a cliff for many orgs.
- Energy and fabs → physical constraints Musk wants to escape via orbit.
The chart only advertises layer one. Builders live in all three.
Singularity-adjacent language without new definitions
Musk has also leaned into singularity-flavored framing in the same season — covered in our What is the AI singularity? piece alongside Astra / soft-vs-hard distinctions. “Supersonic tsunami” is not a technical singularity definition. It is marketing for discontinuous-feeling acceleration.
Useful distinctions to keep:
- Soft singularity / steep S-curve: rapid capability growth that societies can still meter with institutions.
- Hard discontinuity: recursive self-improvement that outruns governance (RSI ladder, DeepMind AGI→ASI pathways).
- Meme exponential: unlabeled bars that end at “now.”
Do not upgrade a meme into a hard-takeoff proof. Do not dismiss real acceleration because the chart is unlabeled — measure it yourself.
How to read exponential AI claims without getting washed out
A practical checklist for product, research, and policy teams:
- Demand the series. Metric name, source, preprocessing, log vs linear axis.
- Separate capability from deployment. A model that scores well can still fail your harness or your compliance review.
- Watch the mid-band. Open weights compressing “good enough” work is the Calacanis side; the tsunami does not erase that.
- Price the flood. More capable agents raise token burn and incident surface — see enterprise token governance.
- Keep human waterlines. Refusal policy, eval gates, and safety score–style consistency checks are how you stay upright when capability spikes.
if chart has no y_label:
    treat_as_rhetoric()
    do_not_update_budget()
else:
    replicate_series()
    compare_to_internal_evals()
What explainx.ai would put on the y-axis (if forced)
If we had to sketch candidate series that vaguely match a 2023→2026 hockey stick — without claiming Musk meant any of them:
| Candidate y-axis | Why it might look vertical by mid-2026 |
|---|---|
| Global AI inference tokens | Agent products + cheap APIs |
| Frontier training FLOP budgets | Multi-lab CapEx race |
| Open-weight “near-frontier” releases | Kimi / Qwen / DeepSeek / Inkling cadence |
| Public agent benchmark ceilings | SWE / Terminal / HLE movement |
| Media attention / X engagement | Self-referential, but real |
Each needs its own paper. None justify unlabeled bars in a board deck.
Why “supersonic” is doing unfair work
A tsunami is already an overwhelm metaphor. Adding supersonic stacks speed-of-sound imagery on top of inundation — you are not just flooded; you are flooded before you hear it coming. That is a strong emotional payload for followers who already believe takeoff is near. It is a weak payload for operators who need lead time: procurement cycles, eval suites, and incident response do not move at Mach 1 because a chart went vertical.
Contrast three tempos teams actually live in:
- Model release tempo — weeks to months between notable drops in 2026.
- Org adoption tempo — quarters to wire routing, security review, and finance controls.
- Institutional tempo — years for law, insurance, and workforce adjustment (pacing debates).
Musk’s chart collapses (1) into a single skyline and invites you to pretend (2) and (3) updated at the same rate. They did not. The useful managerial sentence is closer to: capability and spend are compounding; your control plane is not unless you invest in it.
That is also why open-weight floods matter. When mid-tier capability gets cheap (DeepSeek Flash traffic, Asia token share), the “water” is not only frontier labs — it is every startup that can rent a good-enough model. A tsunami of mediocre-but-shippable agents creates different risks than a single lab’s SOTA jump: volume abuse, prompt injection at scale, and support debt. Unlabeled acceleration charts rarely distinguish those failure modes.
For internal communications, steal the silhouette if you must — then label your own axes: “weekly resolved coding tickets by model tier,” “P1 incidents involving agents,” “$ per successful eval.” Those plots persuade finance and security. Vibes plots persuade timelines.
Related on explainx.ai
Update — August 17, 2026: Days after this chart, Musk gave The Economist a specific date for it — AI exceeding the sum of all human intelligence by roughly 2031. See Musk's 2031 AGI prediction, checked against his timeline record.
- Musk predicts AI beats all human intelligence combined by 2031 (Economist)
- AI Traffic Overtook Human Traffic — What Builders Should Actually Do — Musk endorsed Cloudflare's 1,000x bot-traffic forecast on X; this post applies the same skeptical read
- Calacanis vs Musk — open vs frontier gap
- What is the AI singularity? (Musk / Astra context)
- Musk space compute vs Calacanis local tokens
- Has AI reached superintelligence? Astra debate
- Pacing the Frontier employee letter
- AI benchmarks complete guide
- DeepMind AGI to ASI pathways
- Why AI companies want you using agents — token economics
- Inkling-Small open weights
Primary sources
- Elon Musk’s August 3, 2026 X post: “AI is a supersonic tsunami” with the unlabeled Jul 2023–Jul 2026 bar chart
- Public reply thread highlighting missing axis labels
- Related explainx.ai coverage of Musk’s singularity and open–frontier arguments the same week
Chart interpretation and reply framing reflect the public X post as of August 3, 2026. Without an official series definition from Musk or xAI/SpaceXAI, the figure remains rhetoric. Verify primary posts and prefer labeled internal metrics for planning.