



July 16–17, 2026: Kr$na (@krishdotdev, full-stack AI engineer) posted a four-bar chart titled "The new development cycle in one image." Within hours, ThePrimeagen reposted it — "Discovering what we already knew from first principles" — and Grok's news summary framed the same tension: AI tools like Claude Code collapse prototyping from weeks to hours, but bugs, edge cases, and security still eat months.
The chart is simple. The calendar implications are not.
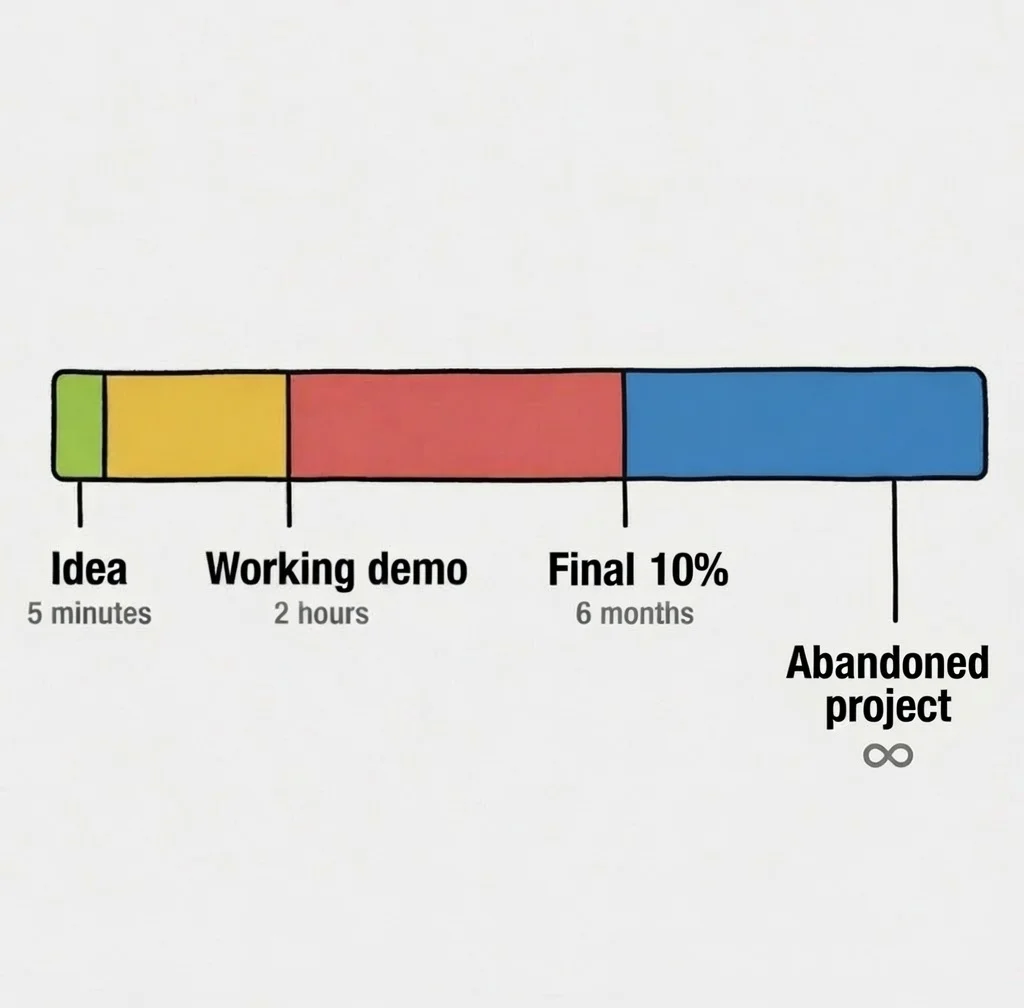
Chart by @krishdotdev, July 16, 2026 — reposted by @ThePrimeagen and others on X.
TL;DR — what each bar means
| Phase | Color | Time | What AI actually accelerates |
|---|---|---|---|
| Idea | Green | ~5 min | Brainstorming, spec drafts, architecture sketches, prompt → scaffold |
| Working demo | Yellow | ~2 hours | Happy-path UI, CRUD, agent-driven file edits, local test green once |
| Final 10% | Red | ~6 months | Edge cases, security, perf, a11y, migrations, observability, legal/compliance |
| Abandoned project | Blue | ∞ | Demo shipped to X; red bar never funded; repo archived |
Ray @ravikiran_dev7 captured the Claude estimation joke in the same thread: Claude says "this project will probably take 3 months" — while the chart says the demo took two hours. Both can be true. Agents estimate production completion; builders celebrate demo completion.
Why the yellow bar collapsed but the red bar didn't
What got faster (green + yellow)
Tools like Claude Code, Cursor, Codex, and Kimi K3-class models changed the first two bars:
- Idea → runnable code no longer requires a sprint of manual scaffolding
- In-IDE agents edit files, run tests, and iterate on errors without context-switching to Stack Overflow
- Vision + UI models turn screenshots into components — the demo bar is literally what nextjs.org/evals and Arena Frontend Code measure
This is real. It is not hype. It is also misleading if you stop measuring after yellow.
What didn't get faster (red)
The final 10% is everything that does not show in a Loom:
| Red-bar work | Why agents struggle |
|---|---|
| Edge cases | Long tail of user behavior — sparse in training data |
| Security | Threat modeling requires adversarial thinking, not pattern completion |
| Performance at scale | Demos run on happy paths; prod runs on p99 and noisy neighbors |
| Accessibility & i18n | Easy to forget in a 2-hour demo; expensive to fix later |
| Observability & on-call | Metrics, alerts, runbooks — invisible in a screen recording |
| Migration & rollback | Real users have existing data; demos use seed fixtures |
Kr$na's chart is the 2026 restatement of the 90% rule: the last mile was always disproportionately expensive. AI moved the demo milestone left on the timeline; it did not repeal Brooks's law for polish.
ThePrimeagen, Chollet, and the skill debate
The chart triggered agreement more than controversy — ThePrimeagen's "first principles" line landed because senior builders already lived this shape before LLMs. AI just made the gap between bars 2 and 3 visually absurd.
The skill question is separate:
| View | Who said it | Implication |
|---|---|---|
| AI amplifies experts | François Chollet | Stronger codegen rewards people who specify constraints and catch bad evidence |
| Interfaces matter more than typing | ThePrimeagen | Defining structs, APIs, and boundaries — acceptable to be the review bottleneck |
| Demo code doesn't scale | Mitchell Hashimoto vibe-coding thread | Prototypes that skip red-bar work demand painful rewrites |
explainx.ai covered this split in should developers stop reviewing AI-generated code?. Kr$na's chart does not pick a side — it shows where calendar time goes if you treat yellow as done.
Emil Kowalski (@emilkowalski, Linear, animations.dev) sits in the design-polish camp the red bar describes: motion, micro-interactions, and feel are exactly the kind of work that does not compress to two hours because they require taste loops, not token loops.
Mapping the chart to Boris Cherny's adoption ladder
Cherny's Steps of AI Adoption (published the same week) names why teams stall in the red bar:
| Cherny step | Chart bar | Bottleneck |
|---|---|---|
| Step 1 Assisted | Yellow (supervised demo) | You read every edit — fast demo, slow trust |
| Step 2 Parallel | Yellow → early red | Self-verification (tests, lint, security scan) before you review |
| Step 3 Supervised autonomy | Red in background | Proactive maintenance — polish runs while you build |
| Step 4 AI-native | Red automated per domain | Migrations, triage, fuzzing — if guardrails exist |
Teams stuck at Step 1 get incredible yellow bars and brutal red bars — because every edge case still needs human eyes. Advancing to Step 2 means investing in the verification loop that shrinks red without abandoning to blue.
See loop engineering and Claude Code /goal, /loop, /schedule for the harness layer between demo and production.
The infinity bar — why projects die after great demos
The blue ∞ segment is the chart's punchline. Common paths:
- Demo-as-marketing — thread goes viral; no budget for red bar
- Rewrite trap — yellow code is so demo-shaped that red costs more than greenfield
- Scope creep in red — "just one more edge case" without a ship date
- Burnout — yellow was exhilarating; red is LLM prose and clanker fatigue
- Wrong owner — PM prototype mistaken for eng-ready (vibe coding for PMs warns: don't productionize the prototype)
Mitigation that actually works:
- Define red-bar done before yellow — test matrix, SLO, threat model, launch checklist
- Separate repos or branches for demo spikes vs production lineage
- Time-box yellow — 2 hours is the chart's joke; make it a literal cap for spikes
- Automate red entry — CI fails on missing tests; security review on by default (Cherny Step 2)
- Kill blue early — if red estimate exceeds value, archive at yellow instead of limping to ∞
What Claude's "3 months" estimate actually means
When Claude (or any agent) says a project takes three months, it is often integrating:
- Full red-bar scope (correct for production)
- Unknown unknowns in your domain
- Sequential human review bottlenecks
When you finish in two hours, you built yellow. Both statements coexist. The failure mode is shipping yellow while believing you skipped red — the path to Hashimoto-style rewrites and the infinity bar.
For enterprise teams, this is why AI copy vs craft debates and anti-slop design skills matter: demos default to generic; polish is differentiation.
Practical checklist — shrink red without lying to yourself
| Before you post the demo | Before you call it production |
|---|---|
| Label it spike / POC in README | CI green on your edge-case suite |
| List 10 things that will break | Security review or threat model doc |
| Pick one user persona for yellow | Observability: logs, metrics, alerts |
| Set red budget (days, not ∞) | Rollback tested |
| Use Plan mode / advisor for intent | On-call owner named |
If red budget exceeds value → archive at yellow. That is healthier than the infinity bar.
Summary
Kr$na's July 16, 2026 chart names the 2026 software calendar: 5-minute idea, 2-hour working demo, 6-month final 10%, ∞ abandoned. AI coding agents genuinely compressed green and yellow — Claude Code, Cursor, and frontier models turn scaffolding into an afternoon. ThePrimeagen treated it as first principles; the 90% rule explains why red still dominates. Skill debates (Chollet, Hashimoto) are about who steers, not whether the shape is real. Avoid the blue bar by defining red-bar done early, time-boxing demos, and advancing to verification-heavy agent maturity — not by pretending yellow is ship.
Related on explainx.ai
- Boris Cherny Steps of AI Adoption — 0 to 4 maturity
- Should developers stop reviewing AI-generated code?
- Loop engineering for coding agents
- Claude Code loops — /goal, /loop, /schedule
- Programmers' mental health and LLM burnout
- Vibe coding for product managers — prototype boundaries
- AI psychosis and vibe coding fatigue — Hashimoto thread
- Nutlope Hallmark — anti-AI-slop design skill
Sources: @krishdotdev chart (Jul 16, 2026) · @ThePrimeagen repost · @ravikiran_dev7 Claude estimate joke
Chart and timeline labels accurate as of July 17, 2026 per viral X posts. Times in the meme are illustrative, not measured benchmarks — use them as a planning metaphor, not a sprint estimate.