




Short answer: Posts on November 7–8, 2026 claim Anthropic’s progress per R&D dollar fell about 63% even while yearly capability progress nearly doubled. The claim is third-party arithmetic, not a line in METR’s assessment or in Anthropic’s SEC filings. It multiplies METR’s fitted AECI trend by time, then divides by research and development expense from the Form S-1 registration statement. That ratio can fall while models still improve faster and while Claude still helps researchers work faster — because the numerator is a benchmark slope and the denominator is total R&D cash.
The story matters because it landed during IPO scrutiny and during backlash over redactions in METR’s report. Readers collapse three different ideas — faster models, bigger budgets, and cheaper intelligence — into one scary percentage. This post separates them.
TL;DR: claimed vs verified
| Piece | Verified source | Status |
|---|---|---|
| AECI growth accelerated ~1.9x since Oct 2025 (95% interval 1.5–2.8x) | METR assessment, Nov 5, 2026 | Published by METR |
| Fitted trend described as +15 AECI points/year before, +29 after | Same METR post and charts | Published by METR |
| R&D $1.85B (H1 2025) and $9.74B (H1 2026) | Anthropic S-1 operating expense table, cited in FourWeekMBA’s Nov 8 analysis | Check EDGAR; we matched the quoted table via that secondary walk-through |
| ~63% drop in points per R&D dollar | Michael Wiebe on X, Nov 7; FourWeekMBA arithmetic | Not an official metric |
| “Benchmaxxed” models | Social posts quoting METR charts | Opinion; METR lists overfitting to AECI tasks as a caveat, not proof of tuning |
Where the 63% comes from
The chain is simple enough to reproduce in a spreadsheet, which is why it spread quickly.
Step 1 — capability pace from METR. METR fits Anthropic’s AECI (Anthropic’s version of the Epoch Capabilities Index). It reports benchmark scores growing at about 1.9x the pre-October 2025 rate, with a 95% confidence interval of 1.5x to 2.8x. Commentary on the chart describes a pre-breakpoint slope near +15 points per year steepening to about +29 points per year after the breakpoint METR places in late 2025.
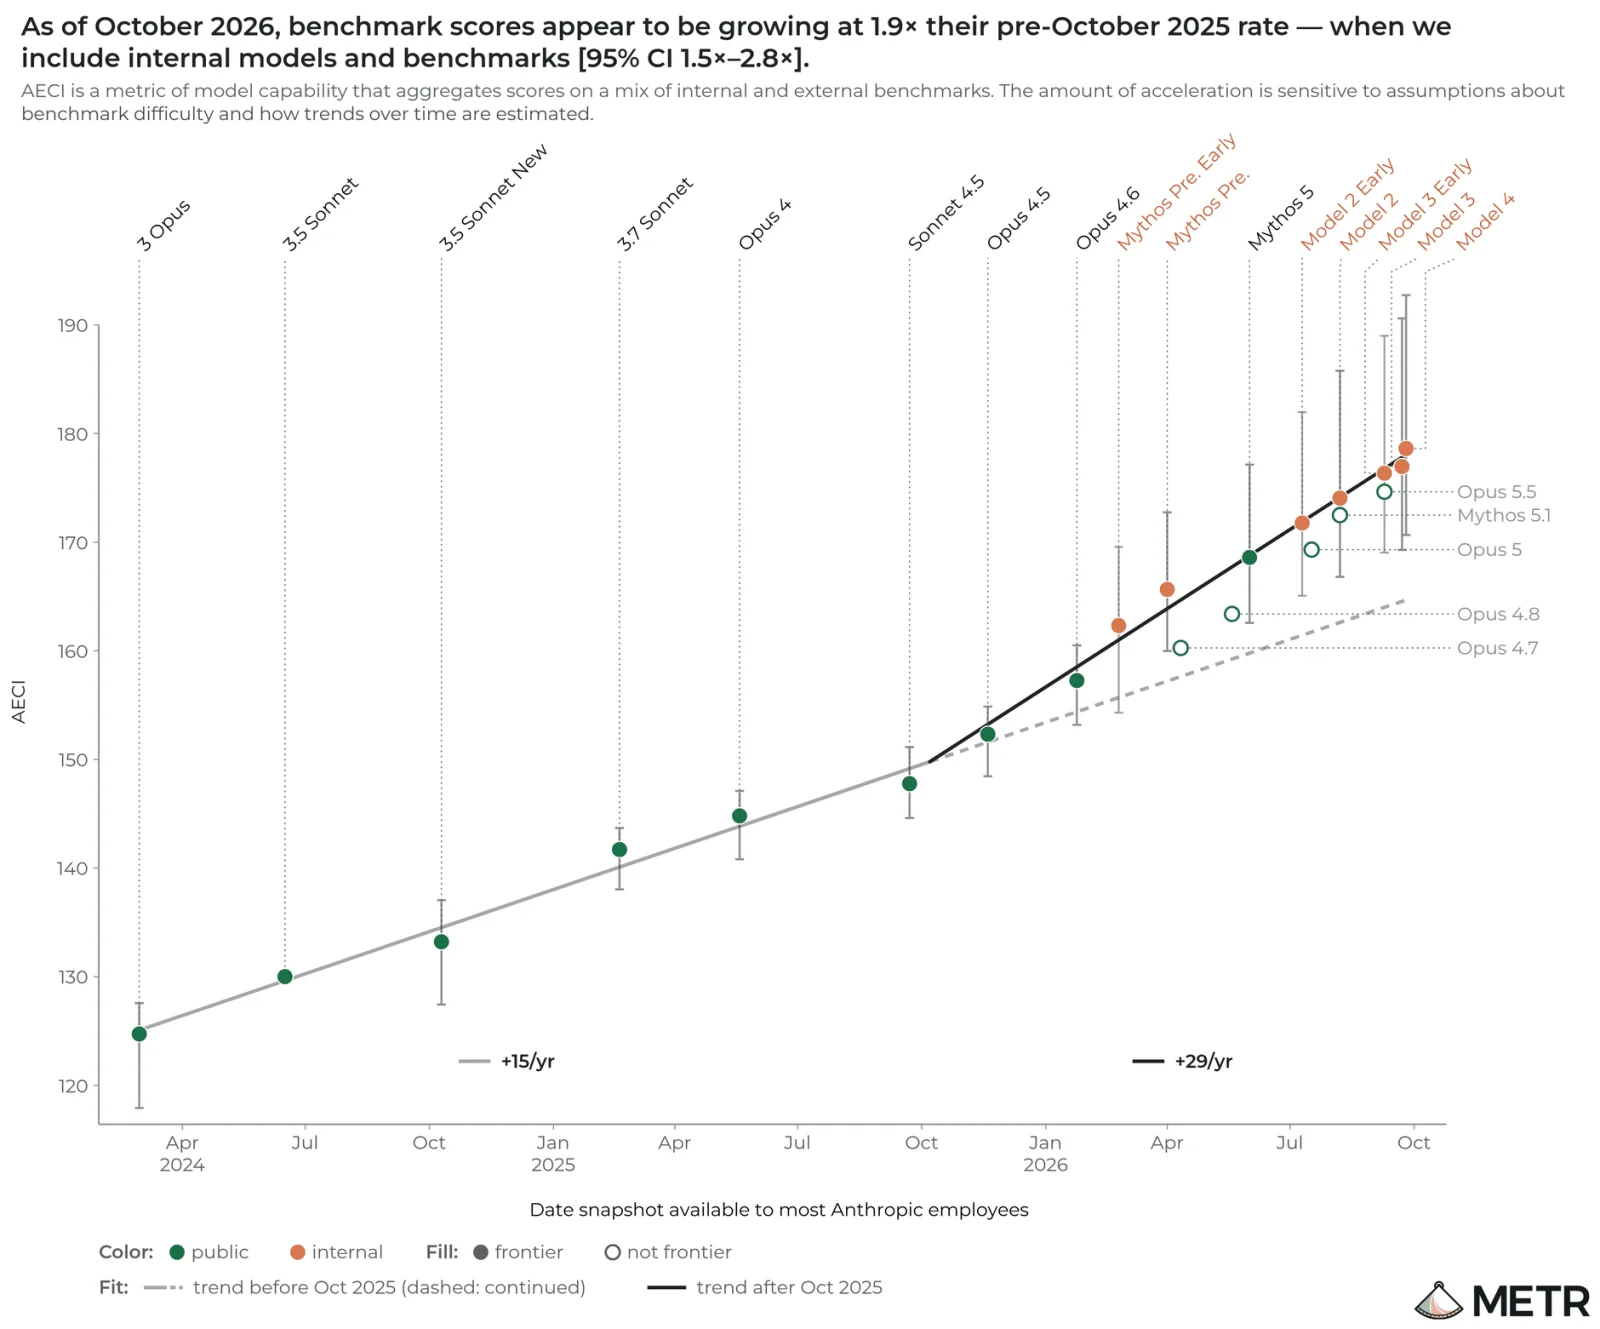 METR AECI chart: +15 points per year before October 2025 steepens to +29 after, a 1.9x acceleration estimate
Image: METR
Step 2 — halve the annual rates for a six-month window. Analysts often translate +15/year into 7.5 AECI points in six months for the first half of 2025, and +29/year into 14.5 points in six months for the first half of 2026. That step is conservative modeling, not a number METR prints for each fiscal half.
Step 3 — divide by R&D from the S-1. The same analyses quote Anthropic’s registration statement as listing research and development of $1,850 million for the six months ended June 30, 2025 and $9,741 million for the six months ended June 30, 2026, alongside full-year figures of $2,275 million (2024) and $6,338 million (2025). The filing describes that line as compute and infrastructure for model development and internal usage, plus personnel.
Step 4 — form points per billion dollars. Dividing the half-year point estimates by spend yields about 4.05 points per billion dollars in H1 2025 and about 1.49 in H1 2026. The percentage change between those two ratios is about -63%. Michael Wiebe’s November 7 post on X states the conclusion plainly: progress per R&D dollar fell 63% while progress per year doubled.
Neither METR nor Anthropic performs that division in their public documents. FourWeekMBA labels the ratio descriptive only and warns that falling points per dollar does not, by itself, show AI failed to raise research productivity.
What each side of the fraction actually measures
Treat the inputs as different currencies.
AECI is a benchmark composite. METR used internal scores, including unreleased models, to estimate acceleration on well-specified tasks. It explicitly cautions that:
- The true acceleration could be nearer 1.3x or 3x than the central guess.
- Growth on graded tasks may not transfer to messy real-world work.
- Recent gains may reflect overfitting to tasks inside AECI.
- Compute scaling is not the driver METR found for the post-2025 break — but much of the evidence behind that claim was redacted.
R&D expense is a cash bucket. IPO filings bundle training compute, inference for research, labs, and people. When H1 2026 R&D is 5.3x H1 2025, you are watching frontier-scale compute purchases landing on the income statement, not a clean “dollars spent per public capability point” experiment.
That mismatch is why serious summaries pair the ratio with disclaimers. A lab can accelerate release cadence (what builders feel) while points per audited dollar fall (what spreadsheet analysts see) if spending scales faster than a narrow index.
 A green lens over a model scorecard, illustrating outside auditors comparing benchmark trends to company spending
What is new versus our November 5 METR coverage
explainx.ai already published METR’s ~2x acceleration estimate and the redaction fight, including November 6–7 updates on conflicts of interest and Sam McCandlish’s posts on X. This post does not re-litigate those findings.
The November 8 wave adds a financial markets lens:
- It ties METR’s slope change to S-1 R&D lines readers can find in IPO disclosure coverage.
- It revives productivity anxiety during Anthropic’s listing process, next to S-1 language on dramatically accelerated progress and internal Claude usage claims.
The interesting tension is not “slowdown.” METR argues capabilities on spec tasks likely sped up. The tension is spend scaling faster than a fitted benchmark index, while the company also says Claude does a growing share of its own research — see Anthropic’s R&D automation index post for the self-reported side.
Social posts and what they add (and do not prove)
Posts on X from November 7–8 echo the same arithmetic: @kimmonismus summarizing “progress per dollar fell 63%” and @CompleteSkeptic quoting a chart with “good thing none of the models are benchmaxxed, right?” Those are reader reactions, not primary sources.
METR’s own text is more careful. It runs robustness checks with acceleration between 1.1x and 2.9x depending on benchmark inclusion, dating, and saturation. It lists reasons it could be over- or under-estimating acceleration. None of that equals “models were gamed to AECI.” It does mean you should not treat AECI as revenue-grade productivity accounting.
For governance context on who saw the data, see Anthropic’s embedded METR evaluator program and METR’s separate high-access assessment, which METR says is not the same engagement.
How to read the ratio if you build on Claude
Do not use 63% as a capability forecast. It is not a forecast. It is a ratio built from a benchmark fit and a financial statement line.
Do use it as a cost-pressure signal. When R&D grows 5.3x in a year-over-year half, the filing is telling you where margin pressure comes from, even if models improve faster. That connects to usage limits, enterprise pricing, and compute commitment headlines builders already track.
 A bell beside market paperwork illustrates IPO investors weighing R&D spend against capability headlines
Keep your own evals. METR’s estimate is about Anthropic’s internal trend on a curated task mix. Your product should still run held-out tests on your data. For methodology background, see our guide to reading model cards and harness reliability notes.
Separate safety pacing from IPO optics. McCandlish argued redactions protect commercial secrets and slow rival catch-up — a claim we summarized in the November 7 update on the main METR post. The 63% arithmetic is a different audience: investors asking whether spend efficiency supports the valuation. Policy readers and safety researchers should not merge the two debates without checking definitions.
Limits of this analysis
- We did not independently re-parse the full S-1 HTML tables in EDGAR; the $1.85B / $9.74B pair matches the table reproduced in FourWeekMBA, which cites the October 26, 2026 registration statement. Open EDGAR before betting money on the exact millions.
- We did not reproduce METR’s AECI regression; we cite its published 1.9x acceleration and described slopes.
- The half-year point estimates (7.5 and 14.5) are analyst allocations of annual fitted rates, not METR disclosures.
- No causal claim is justified: spending does not “cause” benchmark points in the filing, and METR does not test elasticity of AECI to R&D dollars.
What to watch next
- Anthropic’s promised progress report — The Verge noted Anthropic plans its own release in coming weeks after the redaction fight. That may or may not include efficiency metrics.
- IPO roadshow language — Watch whether management discusses R&D productivity or only revenue and safety thresholds.
- Next model drops — Real-world cadence is the builder-relevant check on whether acceleration is felt in products, as with prior Claude launch coverage.
- Independent replications — If Epoch or others publish third-party capability indices with spending data, the points-per-dollar debate may get better denominators.
Related reading
- METR: ~2x Anthropic acceleration and redactions
- Anthropic amended S-1: Q3 revenue and commitments
- Anthropic S-1 amendment on accelerated-progress threshold
- Anthropic R&D automation index
- OpenAI on research acceleration with coding agents
- Epoch InnovationEval: can AI automate AI R&D?
- Anthropic draft prospectus compute and losses
Arithmetic and quotes follow METR’s November 5, 2026 assessment, Anthropic’s SEC registration statement as relayed by FourWeekMBA on November 8, 2026, and public posts on X. Capability and spending may move before filings catch up.