



Web performance has evolved from a nice-to-have to a core frontend skill in 2026. With Google's Core Web Vitals affecting SEO rankings and conversion rates, and edge computing reducing latency dramatically, performance-first architecture has become the standard for modern web applications.
This comprehensive guide covers Core Web Vitals optimization, edge computing strategies, performance budgets, and measurement tools based on 2026 production patterns and real-world results.
Why Performance Matters (2026 Data)
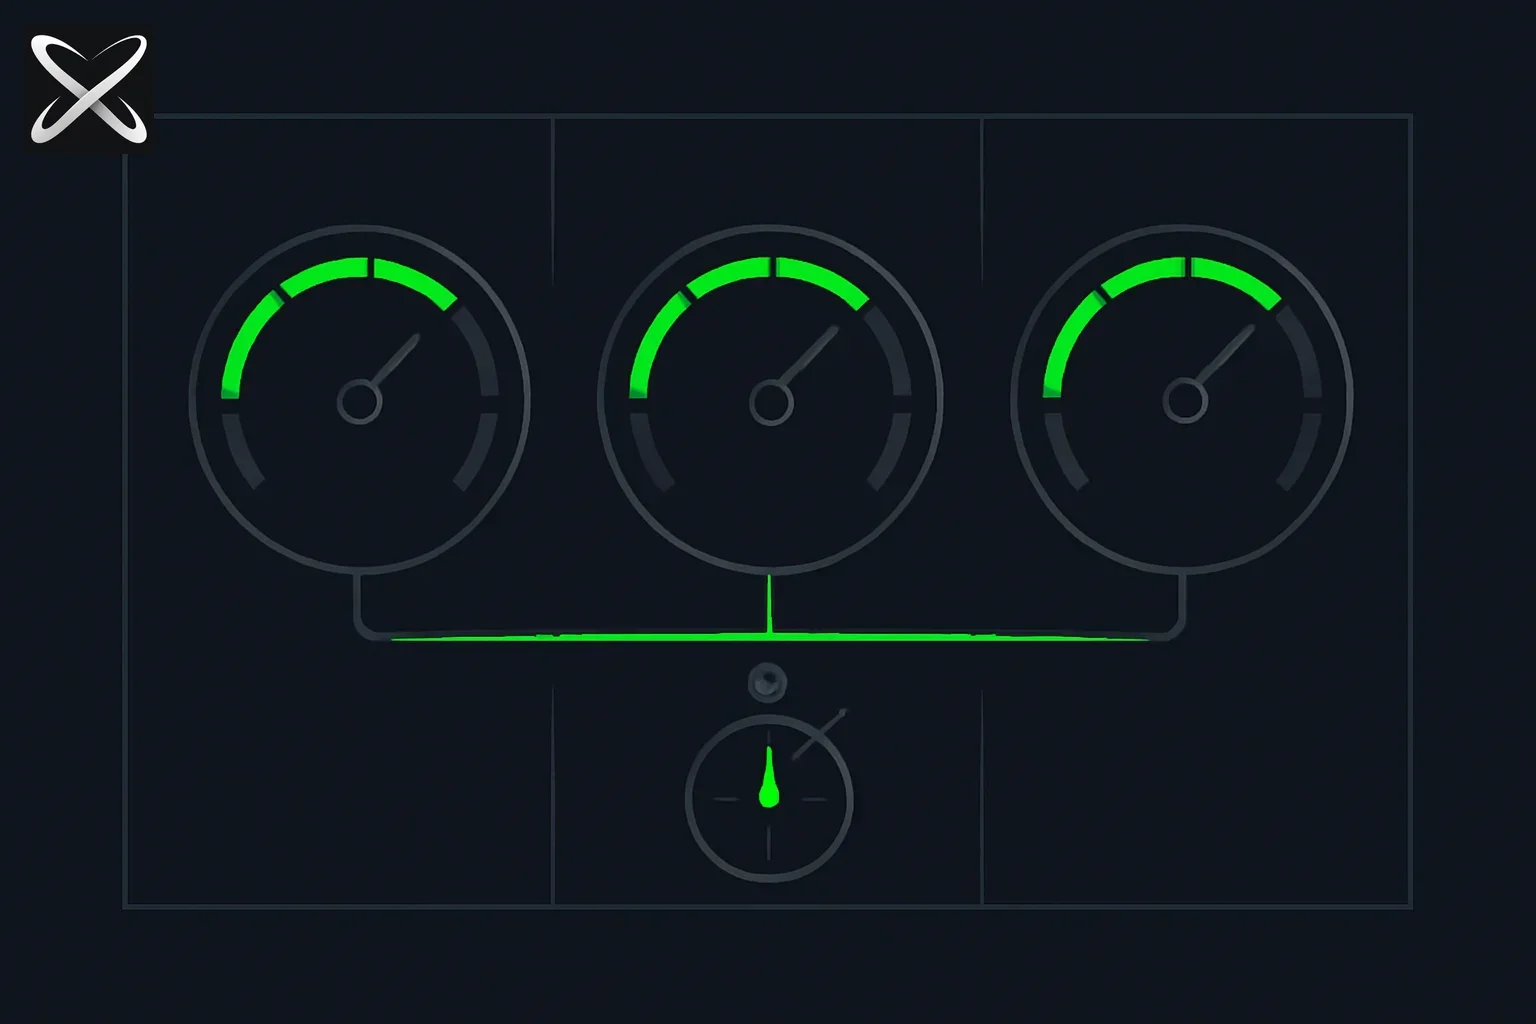 Core Web Vitals 2026 guide — three speedometer gauges for LCP, INP, and CLS pointing into the green zone
Business and search implications
Faster and more stable pages can improve a user's experience, but this article does not establish a universal conversion, revenue, or ranking effect. Use comparable technical measurements and a separate business evaluation before attributing an outcome to performance work.
Google describes page experience as part of its search guidance, not a guarantee that passing every performance threshold will move a particular page to a specific position. Keep content usefulness and technical experience under review together.
Core Web Vitals: The Big Three
1. LCP (Largest Contentful Paint)
What: Time until largest visible content element loads
Thresholds:
- Good: ≤ 2.5s
- Needs Improvement: 2.5s - 4.0s
- Poor: > 4.0s
Common LCP elements:
- Hero images
- Header text
- Video thumbnails
- Background images (CSS)
2. INP (Interaction to Next Paint)
What: Measures responsiveness to user interactions (replaced FID in 2024)
Thresholds:
- Good: ≤ 200ms
- Needs Improvement: 200ms - 500ms
- Poor: > 500ms
What it measures:
- Click responsiveness
- Keyboard interactions
- Tap/touch responses
- All interactions (not just first like FID)
3. CLS (Cumulative Layout Shift)
What: Visual stability—unexpected layout movements
Thresholds:
- Good: ≤ 0.1
- Needs Improvement: 0.1 - 0.25
- Poor: > 0.25
Common causes:
- Images without dimensions
- Ads/embeds without reserved space
- Web fonts causing text reflow
- Dynamic content injection
Optimizing LCP (Loading Performance)
1. Optimize Images (Biggest Impact)
<!-- ✅ Modern image optimization -->
<img
  src="/hero.jpg"
  alt="Hero image"
  width="1200"
  height="600"
  loading="eager"
  fetchpriority="high"
  srcset="
    /hero-400.webp 400w,
    /hero-800.webp 800w,
    /hero-1200.webp 1200w
  "
  sizes="(max-width: 768px) 100vw, 1200px"
/>
Best practices:
- Use WebP/AVIF formats (30-50% smaller than JPEG)
- Set width/height attributes (prevents CLS)
- Use fetchpriority="high" for LCP image
- Responsive images with srcset/sizes
- CDN with image optimization (Cloudflare, Vercel, etc.)
2. Optimize LCP Element Loading
<!-- Preload LCP image -->
<link rel="preload" as="image" href="/hero.webp" fetchpriority="high" />

<!-- Preconnect to external domains -->
<link rel="preconnect" href="https://fonts.googleapis.com" />
<link rel="preconnect" href="https://cdn.example.com" crossorigin />
3. Reduce Server Response Time (TTFB)
Target: TTFB < 800ms (good), < 200ms (excellent with edge)
Strategies:
- Edge computing (deploy to 200+ locations)
- CDN for static assets
- Database query optimization (indexes, caching)
- Server-side caching (Redis, in-memory)
Illustrative latency scenario, not a universal edge-computing result:
| Location | Traditional Server | Edge Computing | Improvement |
|---|---|---|---|
| US East | 50ms | 20ms | 60% faster |
| Europe | 180ms | 35ms | 81% faster |
| Asia | 450ms | 45ms | 90% faster |
| Australia | 320ms | 60ms | 81% faster |
4. Eliminate Render-Blocking Resources
<!-- ❌ Blocking CSS -->
<link rel="stylesheet" href="/styles.css" />

<!-- ✅ Non-blocking CSS for non-critical styles -->
<link rel="stylesheet" href="/critical.css" />
<link
  rel="preload"
  href="/non-critical.css"
  as="style"
  onload="this.onload=null;this.rel='stylesheet'"
/>

<!-- ✅ Defer non-critical JavaScript -->
<script src="/analytics.js" defer></script>
<script src="/non-critical.js" defer></script>
Critical CSS pattern:
<head>
  <!-- Inline critical CSS -->
  <style>
    /* Above-the-fold styles only */
    .hero { background: #000; color: #fff; }
    .header { padding: 1rem; }
  </style>

  <!-- Load full CSS asynchronously -->
  <link rel="preload" href="/full.css" as="style" onload="this.rel='stylesheet'" />
</head>
Optimizing INP (Interactivity)
1. Reduce JavaScript Execution Time
// ❌ Blocking main thread
function processData(largeArray) {
  return largeArray.map(item => {
    // Heavy computation (blocks for 500ms)
    return expensiveOperation(item);
  });
}

button.addEventListener('click', () => {
  const result = processData(data); // User waits 500ms!
  updateUI(result);
});
// ✅ Chunk work with scheduler
async function processDataAsync(largeArray) {
  const results = [];

  for (let i = 0; i < largeArray.length; i++) {
    results.push(expensiveOperation(largeArray[i]));

    // Yield to main thread every 50 items
    if (i % 50 === 0) {
      await new Promise(resolve => setTimeout(resolve, 0));
    }
  }

  return results;
}

button.addEventListener('click', async () => {
  updateUI({ loading: true });
  const result = await processDataAsync(data); // UI stays responsive
  updateUI(result);
});
2. Use Web Workers for Heavy Computation
// worker.js
self.addEventListener('message', (e) => {
  const result = expensiveComputation(e.data);
  self.postMessage(result);
});

// main.js
const worker = new Worker('worker.js');

button.addEventListener('click', () => {
  worker.postMessage(data);

  worker.onmessage = (e) => {
    updateUI(e.data); // Main thread stays responsive
  };
});
3. Optimize Event Handlers
// ❌ Re-running expensive logic on every scroll
window.addEventListener('scroll', () => {
  const scrollPos = window.scrollY;
  updateNavbar(scrollPos); // Heavy DOM manipulation
});

// ✅ Throttle/debounce
import { throttle } from 'lodash-es';

window.addEventListener('scroll', throttle(() => {
  const scrollPos = window.scrollY;
  updateNavbar(scrollPos);
}, 100)); // Max once per 100ms
4. Code Splitting and Lazy Loading
// ❌ Load everything upfront
import { HeavyComponent } from './HeavyComponent';
import { Chart } from './Chart';
import { Modal } from './Modal';

// ✅ Load on demand
const HeavyComponent = lazy(() => import('./HeavyComponent'));

function App() {
  const [showModal, setShowModal] = useState(false);

  return (
    <div>
      <Suspense fallback={<Spinner />}>
        {showModal && <HeavyComponent />}
      </Suspense>
    </div>
  );
}
Illustrative bundle and interaction values, not a measured result:
- Initial bundle: 450KB → 180KB (60% reduction)
- INP improvement: 320ms → 140ms (56% faster)
Optimizing CLS (Visual Stability)
1. Set Dimensions on Images and Videos
<!-- ❌ No dimensions (causes layout shift when loaded) -->
<img src="/photo.jpg" alt="Photo" />

<!-- ✅ Dimensions set (reserves space) -->
<img src="/photo.jpg" alt="Photo" width="800" height="600" />

<!-- ✅ Modern aspect ratio (responsive) -->
<img
  src="/photo.jpg"
  alt="Photo"
  style="aspect-ratio: 16/9; width: 100%; height: auto;"
/>
2. Reserve Space for Ads and Embeds
/* Reserve space for ad slot */
.ad-slot {
  min-height: 250px; /* Matches ad size */
  background: #f0f0f0;
}

/* Reserve space for embedded content */
.video-embed {
  aspect-ratio: 16/9;
  width: 100%;
  background: #000;
}
3. Avoid Injecting Content Above Existing Content
// ❌ Injects at top (shifts content down)
function showNotification(message) {
  const div = document.createElement('div');
  div.textContent = message;
  document.body.prepend(div); // CLS!
}

// ✅ Fixed position (doesn't affect layout)
function showNotification(message) {
  const div = document.createElement('div');
  div.textContent = message;
  div.style.position = 'fixed';
  div.style.top = '20px';
  div.style.right = '20px';
  document.body.appendChild(div); // No CLS
}
4. Use font-display for Web Fonts
/* ❌ FOIT (Flash of Invisible Text) - layout shift */
@font-face {
  font-family: 'Custom';
  src: url('/font.woff2') format('woff2');
}

/* ✅ FOUT (Flash of Unstyled Text) - fallback visible, possible reflow */
@font-face {
  font-family: 'Custom';
  src: url('/font.woff2') format('woff2');
  font-display: swap; /* Show fallback; match metrics to reduce shifts */
}
Edge Computing for Performance
Edge computing has become standard in 2026 for performance-critical applications.
What is Edge Computing?
Run code closer to users on globally distributed servers instead of centralized data centers.
Illustrative Latency Scenario
These figures are examples for a measurement worksheet, not observed deployment results or availability guarantees.
| Metric | Traditional (US-East) | Edge (Global) | Improvement |
|---|---|---|---|
| TTFB (US) | 50ms | 20ms | 60% faster |
| TTFB (Europe) | 180ms | 35ms | 81% faster |
| TTFB (Asia) | 450ms | 45ms | 90% faster |
| Availability | 99.9% (single region) | 99.99% (multi-region) | 10x better |
Edge Platforms (2026)
| Platform | Edge Locations | Use Case |
|---|---|---|
| Cloudflare Workers | 300+ | Full-stack apps, APIs |
| Vercel Edge Functions | 100+ | Next.js, serverless |
| Netlify Edge Functions | 90+ | Jamstack, personalization |
| AWS CloudFront Functions | 400+ | Enterprise, compliance |
| Fastly Compute | 70+ | Media, high-traffic |
Example: Edge Personalization
// edge-function.js (runs at edge)
export default async function handler(request) {
  const country = request.geo.country;
  const currency = getCurrencyForCountry(country);

  // Fetch from regional database (closer to user)
  const products = await fetchProducts(country);

  return new Response(
    JSON.stringify({ products, currency }),
    {
      headers: {
        'Content-Type': 'application/json',
        'Cache-Control': 's-maxage=60', // Cache at edge
      }
    }
  );
}
Illustrative result to test, not a claim that the snippet was benchmarked:
- TTFB: 450ms → 45ms (10x faster for Asia users)
- Personalization: Dynamic content without performance penalty
- Cache hit rate: 85% (most requests served from edge cache)
Performance Budgets
Performance budgets define limits to prevent performance regression.
Recommended Budgets (2026)
| Resource | Budget | Target |
|---|---|---|
| Total JavaScript | < 200KB (gzipped) | Good LCP/INP |
| Total CSS | < 50KB (gzipped) | Fast render |
| Images (initial) | < 500KB | Good LCP |
| Fonts | < 100KB | Minimal CLS |
| Third-party | < 100KB | Protect against bloat |
| Total page size | < 1MB | Good mobile experience |
Enforcement
// package.json
{
  "scripts": {
    "build": "next build",
    "size-check": "bundlesize"
  },
  "bundlesize": [
    {
      "path": "./dist/bundle.js",
      "maxSize": "200 KB",
      "compression": "gzip"
    },
    {
      "path": "./dist/styles.css",
      "maxSize": "50 KB",
      "compression": "gzip"
    }
  ]
}
CI/CD integration:
# .github/workflows/performance.yml
name: Performance Budget
on: [pull_request]
jobs:
  check:
    runs-on: ubuntu-latest
    steps:
      - uses: actions/checkout@v2
      - run: npm install
      - run: npm run build
      - run: npm run size-check # Fails if over budget
Measurement and Monitoring
Lab Tools (Development)
| Tool | Use Case |
|---|---|
| Lighthouse | Overall performance score |
| WebPageTest | Detailed waterfall, filmstrip |
| Chrome DevTools | Profiling, network timeline |
| Calibre | Automated testing, regression detection |
Field Tools (Real Users)
| Tool | Metrics |
|---|---|
| Google Search Console | Core Web Vitals (real user data) |
| web-vitals library | Client-side measurement |
| Sentry Performance | RUM (Real User Monitoring) |
| Datadog RUM | Enterprise monitoring |
Real User Monitoring Setup
// app.js
import { onCLS, onINP, onLCP } from 'web-vitals';

function sendToAnalytics(metric) {
  // Send to your analytics endpoint
  fetch('/analytics', {
    method: 'POST',
    body: JSON.stringify(metric),
    keepalive: true, // Ensure sent even if user navigates away
  });
}

onCLS(sendToAnalytics);
onINP(sendToAnalytics);
onLCP(sendToAnalytics);
Framework-Specific Optimizations
Next.js (2026)
// next.config.js
module.exports = {
  images: {
    formats: ['image/avif', 'image/webp'], // Modern formats
    deviceSizes: [640, 750, 828, 1080, 1200],
    minimumCacheTTL: 31536000, // 1 year
  },
  experimental: {
    optimizeCss: true, // Automatic CSS optimization
    optimizePackageImports: ['lodash', 'date-fns'], // Tree-shake packages
  },
  compiler: {
    removeConsole: process.env.NODE_ENV === 'production', // Remove console.log
  },
};
React Server Components
// Server Component (zero bundle impact)
async function ProductPage({ id }) {
  const product = await getProduct(id); // Server-only

  return (
    <div>
      <ProductDetails product={product} />

      {/* Only client component adds to bundle */}
      <AddToCartButton productId={id} />
    </div>
  );
}
Common Performance Anti-Patterns
| Anti-Pattern | Problem | Solution |
|---|---|---|
| Import entire library | import _ from 'lodash' (70KB) | import debounce from 'lodash-es/debounce' (2KB) |
| No lazy loading | All routes in initial bundle | Code splitting, lazy imports |
| Client-side rendering | Slow FCP, LCP | SSR, SSG, or hybrid |
| No image optimization | 5MB images | Resize, compress, modern formats |
| Blocking third-party scripts | Analytics blocks render | Use defer/async attributes |
| No caching strategy | Re-fetch same data | Cache-Control headers, service workers |
Example Measurement Worksheet
Illustrative e-commerce scenario; no production test or business impact is established by these values:
Before:
- LCP: 4.2s
- INP: 380ms
- CLS: 0.28
- Bundle size: 680KB
- Lighthouse: 52
Changes:
- Migrated to Next.js App Router (RSC)
- Implemented edge computing (Vercel)
- Optimized images (WebP, srcset, CDN)
- Code splitting (route-based)
- Removed unused JavaScript (dropped jQuery, Moment.js)
After:
- LCP: 1.8s ✅ (-57%)
- INP: 145ms ✅ (-62%)
- CLS: 0.06 ✅ (-79%)
- Bundle size: 185KB (-73%)
- Lighthouse: 94 (+42pts)
Business validation: Measure conversion and other outcomes separately with a defined comparison. The illustrative technical values above cannot establish revenue, traffic, or ranking improvements.
Diagnose the largest paint before changing architecture
Open a slow representative page and identify the actual largest-contentful-paint element. On one route it may be a hero image; on another it may be a heading. An image-optimization change cannot fix a delay caused primarily by waiting for backend data or by render-blocking styles. Start with the observed element rather than a favorite optimization technique.
Break the loading path into stages: waiting for the document, discovering the resource, downloading it, and displaying it. Ask which stage consumes the time. A large resource suggests compression or responsive sizing. Late discovery suggests checking how the page references the resource. A delayed display after download suggests examining main-thread work and styling.
Google's Web Vitals guide defines the core metrics and how they are evaluated. Use its thresholds as experience targets, not promises of a ranking or revenue increase. Whether a particular performance change improves a business outcome needs its own measurement.
For a worked example, imagine the same hero appears on two otherwise similar pages, but one page loads it much later. Compare their request waterfalls before replacing the image. If the slow page discovers the hero only after executing JavaScript, reducing the file size may help less than making the resource discoverable earlier. This is a diagnostic hypothesis to verify on your page, not a universal explanation.
Reproduce one slow interaction
Pick a concrete interaction users report as sluggish: opening a menu, typing in search, or applying a filter. Record a performance trace while performing that action. Check what runs before the next visible update. A handler may be short while the render it triggers is expensive; optimizing only the handler misses the larger delay.
Reduce the interaction to the work required for feedback. The user may need the button to acknowledge the click immediately while heavier processing happens afterward. Be deliberate about what can move off the critical path and what must complete before the next state is correct.
Test with realistic data. A filter that appears instant with ten items can behave differently with a full customer dataset. Include the slow case in your review so the improvement does not depend on a tiny demonstration. If you introduce a worker, measure communication and serialization costs as well as the computation it performs.
Find the element that moved, then its cause
A layout shift shows where the visible content moved, but the cause may be a different element inserted above it. Inspect the sequence leading to the movement. An image without reserved space, an expanding banner, a font substitution, and a late-loading embed require different interventions.
Reserve space that matches the actual content shape. A fixed placeholder that is too short can still shift the page when the final content arrives. For text, a fallback font with different metrics can change line breaks. Google's CLS optimization guide explains these causes; showing fallback text quickly does not by itself guarantee zero layout movement.
Recheck after the change at narrow and wide viewports. The same image can have a different height in each layout, and a heading may wrap onto another line. One desktop screenshot is evidence about that desktop state, not the complete range of page behavior.
Keep laboratory and field evidence separate
A controlled laboratory run is useful for reproducing a defect and comparing a targeted change. Real-user measurements show how the application behaves across actual devices, networks, and interaction patterns. These sources answer related questions but need not produce identical numbers.
Record the tested route, build, device assumptions, network conditions, and number of runs. Compare like with like. If the “after” run uses a faster machine or a warm cache while the “before” run was cold, the apparent improvement is confounded. Repeat comparable runs before making a quantitative claim.
For field data, inspect the relevant audience segment and time period. An aggregate can hide a problem affecting a particular route or device class. A deployment may also need time to accumulate observations before the field comparison becomes useful. Do not claim a live improvement solely because a local audit score rose.
Turn a budget failure into an ownership decision
A budget should identify which resource grew and why. If a new chart library increases the initial bundle, ask whether it is needed on the first view or can load when the chart is opened. If an advertising integration shifts content, assign someone to review its reserved space and loading behavior.
Document accepted exceptions with a reason and an owner. A useful budget keeps the tradeoff visible; it does not force every route into an arbitrary identical size. Review the exceptions when requirements change, because an originally justified cost can remain after the feature it served disappears.
The strongest performance workflow moves from a specific slow experience to a trace, a narrow change, and a comparable measurement. Architecture changes can contribute, but they should follow the diagnosis. Keep the result scoped to what you measured and maintain monitoring so the same defect does not return unnoticed.
Conclusion
Web performance in 2026 is about architecture, not just optimization tricks. Edge computing, server-first frameworks (RSC), and performance budgets have become standard practice for modern web applications.
Key takeaways:
- Core Web Vitals describe user experience; evaluate business outcomes separately
- Edge computing can reduce network distance; measure the complete request path
- Server Components can keep server-only dependencies out of client bundles
- Performance budgets prevent regression
- Measure real users, not just lab data
Start with:
- Measure Core Web Vitals (Google Search Console)
- Set performance budgets
- Optimize LCP (images, TTFB, render-blocking)
- Move to edge computing (Vercel, Cloudflare)
- Monitor continuously (RUM)
Performance is not a one-time project—it's a continuous discipline.
For AI-powered performance optimization, explore the MCP ecosystem and agent skills for automated performance testing and optimization.
Resources
- Web Vitals — official Google guide
- Lighthouse — performance auditing
- WebPageTest — detailed performance testing
- web-vitals library — client-side measurement
- Core Web Vitals Report — real user data
Further reading:
Happy optimizing!