explainx / blog
Anthropic's June 2026 Economic Index adds hourly telemetry, artifact classifiers, and a 9,700-person survey. We break down workweek rhythms, token economics, Claude Code autonomy, the junior-job-loss gap, gender usage splits, and what heavy delegators believe about pay and security — with charts and explainx.ai analysis.
Jul 14, 2026
Anthropic's July 14 pledge funds eight Canadian research partnerships with Claude API credits, adds Amii/Mila/Vector to its startup program, and publishes Canada's first Economic Index country brief — 2.6% global share, second-highest per-capita adoption after the US.
Jul 14, 2026
Claude Pro at ₹2,000/mo annual (₹2,399 monthly), Max from ₹11,999, Team from ₹2,399/seat — India's #2 Claude market finally bills in rupees. explainx.ai breaks down GST, payment gaps, and Fable 5 access.
Jul 12, 2026
Anthropic's Fable promo ends Sunday July 12 at 11:59pm PT. From July 13 every Fable token runs on usage credits at API rates. explainx.ai explains what changes today and how to cut costs with Sonnet + advisor patterns.
On June 26, 2026, Anthropic published the sixth Anthropic Economic Index — subtitled Cadences. The @AnthropicAI thread distilled it into three sentences people will repeat for months: Claude follows the rhythms of life (news at 7 a.m., recipes at 6 p.m., sleep advice at 5 a.m.); outputs now have names (artifacts); and over one-third of surveyed users expect AI to do most or nearly all of their work tasks within 12 months — while the heaviest delegators are the most bullish on pay and security.
This is not a press-release recap. Anthropic shipped methodological upgrades (hourly telemetry, artifact classifiers, a linked survey of ~9,700 users) at the same moment Claude Code and Cowork are turning sessions from chat transcripts into long-running agentic work. The report is the first time Anthropic connects what people do with what they believe — and the gaps are where policy, product, and career strategy actually live.
| Topic | Headline finding | So what? |
|---|---|---|
| Cadences | Personal use ~35% weekdays → ~50% weekends; tax queries 8× normal before Apr 15 | Claude is a life tool, not just a work tool — and it tracks real-world deadlines |
| Hourly rhythms | News 7 a.m.; business email peaks 10–11 a.m.; recipes 2.3× at 6 p.m. | Product timing and support load follow circadian patterns |
| Overtime | Top wage quartiles +8% work share nights/weekends; bottom quartiles −4% to −11% | AI extends elite knowledge work; less so for lower-wage occupational tasks |
| Artifacts | 93% of sessions produce a labeled output; explanations (17%) and documents (15%) lead | "Chat" undersells deliverables — reports, code, and plans dominate |
| Token economics | Higher-wage occupations use ~2× tokens; apps/websites use 3×+ median | Compute scales with economic value — see our token economics analysis |
| Autonomy | Claude Code +0.37 higher autonomy (1–5 scale) vs chat/Cowork on same outputs | Agent surfaces change how work gets delegated, not just what gets built |
| Survey | 35%+ expect AI to do most/nearly all work tasks in 12 months | Expectations are shifting faster than observed usage |
| Optimism paradox | Heavy automators most positive on pay (+4.7 pp), security (+4.0 pp), job search | Using agents may calibrate fear downward — or enthusiasts self-select |
| Junior risk | 40% say junior job loss likely; 10% say that about themselves | The "AI replaces entry-level" narrative is widely believed — for other people |
| Gender gap | Women: more active minutes; men: higher Claude Code and automation share | Access ≠ same agentic adoption patterns |
| 10-year hope | 65% want human–AI collaboration; 51% want drudgery automated away | Replacement is not the dominant vision among Claude users |
A year ago, Claude usage looked like chat: user prompt, assistant reply, repeat. Today, Claude Code, Cowork, and API agent loops mean sessions can run hours with tool calls, file writes, and minimal human turns. Chat logs alone no longer describe economic impact.
Three pipeline changes in this release:
That third piece is the leap. Prior indices inferred impact from behavior. This one asks: Do you think AI will take your job? Do you feel safer or poorer? What do you want in ten years?
Personal conversations rise on Saturday and Sunday. Work categories (email, marketing, decks) fall; personal categories (emotional support, medical questions, investment advice) rise — especially in high-income countries.
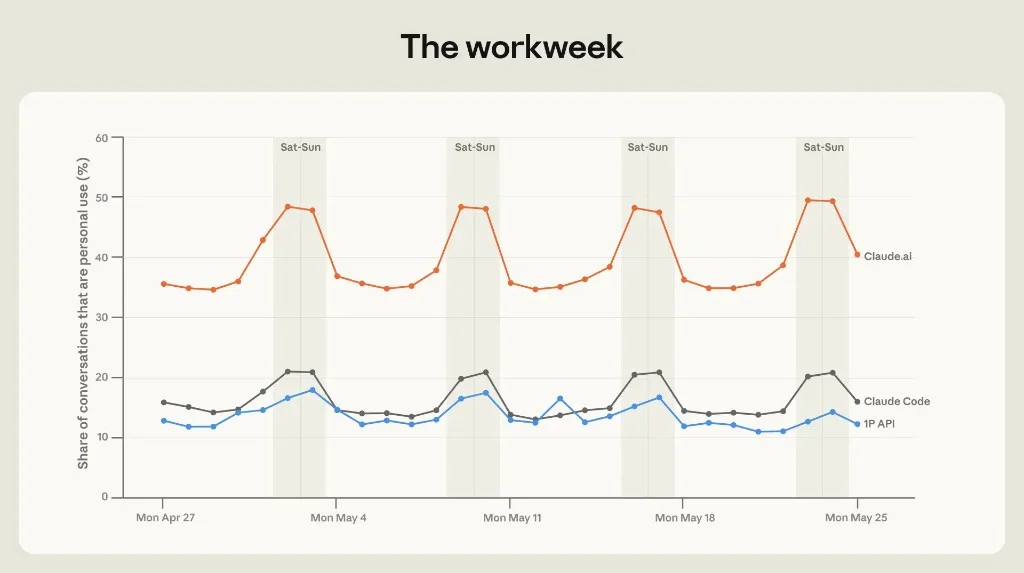
Figure 1.1: Daily share of personal-use conversations. Weekends shaded. Source: Anthropic Economic Index, June 2026.
Claude Code on weekends tells a builder story: backend architecture, API debugging, and data storage drop; AI agent design, quant trading, and gaming rise. Job applications fall too — but starting a business peaks on weekends globally. That matches what we see in the wild: side projects and agent experiments happen when the day job stops — the same cadence as /goal long-running agents and weekend hack sessions.
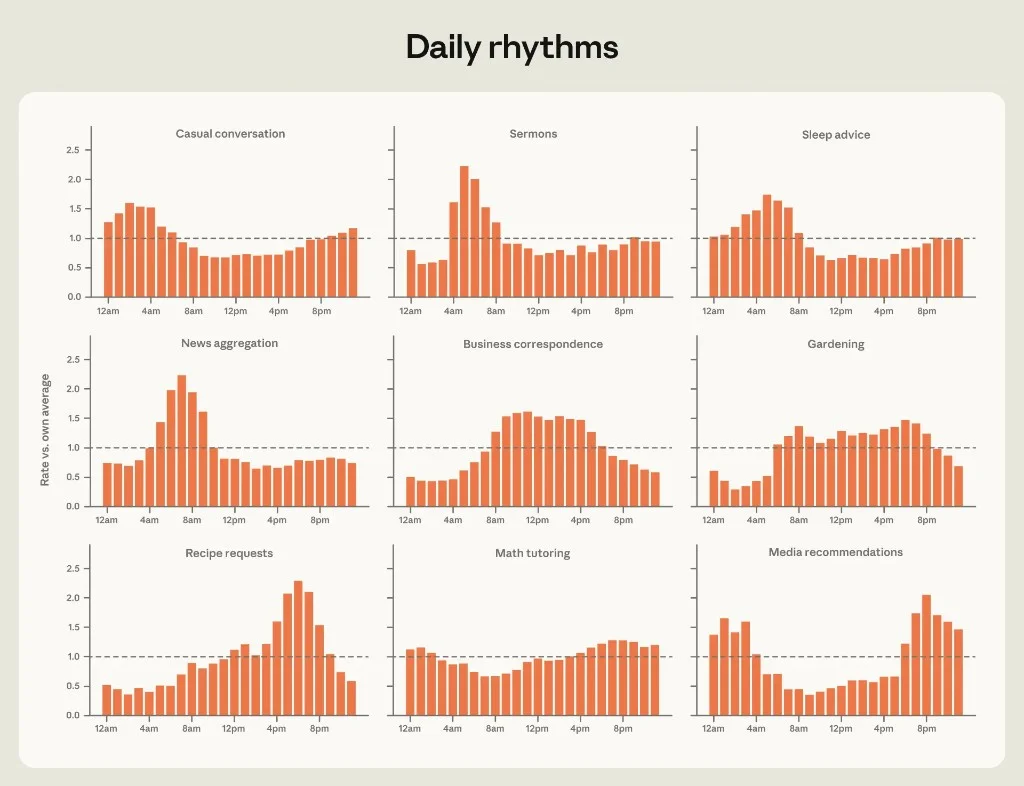
Figure 1.2: Normalized hourly share by request cluster (chat and Cowork). Source: Anthropic.
| Local time | Cluster | Pattern |
|---|---|---|
| ~7 a.m. | News | Morning briefing behavior |
| 10–11 a.m. | Business correspondence | Mid-morning email peak |
| ~6 p.m. | Recipes | 2.3× average frequency |
| Evening | Media recommendations | Leisure planning |
| ~5 a.m. | Sleep advice | Pre-dawn anxiety window |
| All day | Gardening | Stable — "perennial interest" per Anthropic's thread |
explainx.ai read: These are product-design signals. If you ship AI features, time-of-day context is not cosmetic — it is demand shaping. A coding agent that nags at 5 a.m. for sleep advice users is misfiring; a meal-planning skill at 6 p.m. is riding a real wave.
When people do work Claude on nights and weekends, higher-wage occupational tasks gain share:
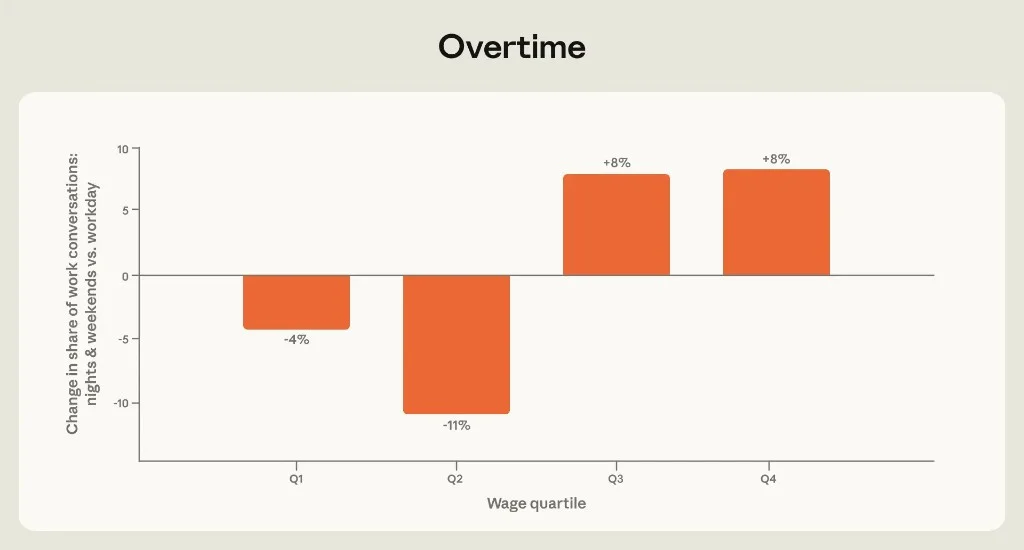
Figure 1.3: Percent change in work-task share, nights/weekends vs weekday hours, by BLS wage quartile.
Q3 and Q4 (upper half) show +8%; Q1 −4%, Q2 −11%. Anthropic's robustness check removing computer/math jobs still shows upper-quartile gains.
Connection: This aligns with AI for business leaders — the highest-value AI workflows are not evenly distributed. Marketing managers and software developers already burn more tokens per session (Chapter 2). Overtime usage suggests always-on knowledge work is being augmented, not replaced, for upper-quartile tasks — while lower-quartile occupational clusters recede from off-hours Claude traffic.
US tax-related conversations spiked to ~8× the May average on April 14–15, then collapsed after the deadline. Non-US traffic stayed flat.
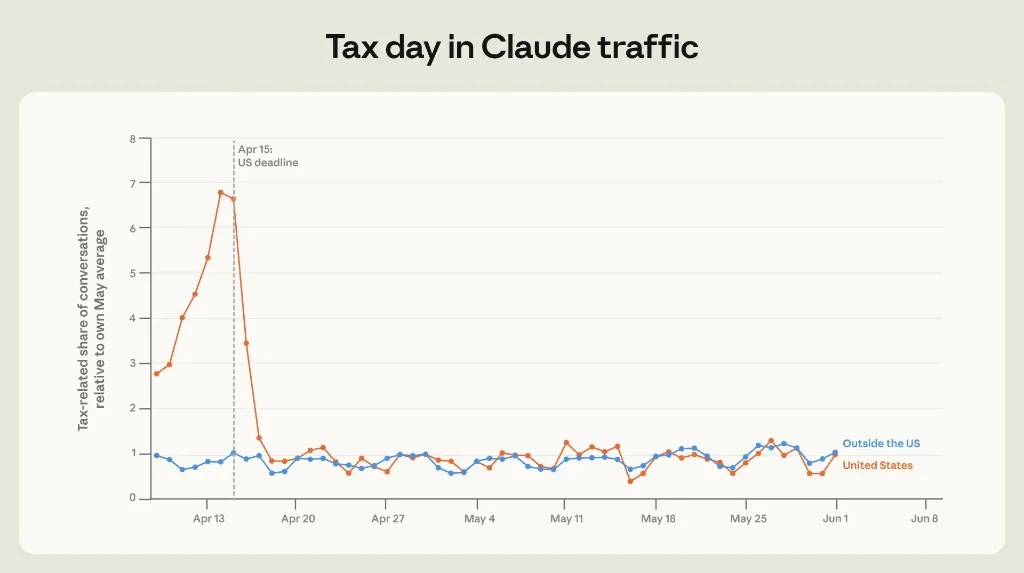
Figure 1.4: Tax-related share relative to May average, US vs outside US.
This is evidence that Claude is not only a creative or coding tool — it is event-driven operational software for high-stakes personal finance. Expect similar spikes around open-enrollment, FAFSA, and regional filing seasons as adoption broadens.
The classifier tags 93% of chat/Cowork sessions with a primary artifact. Top categories:
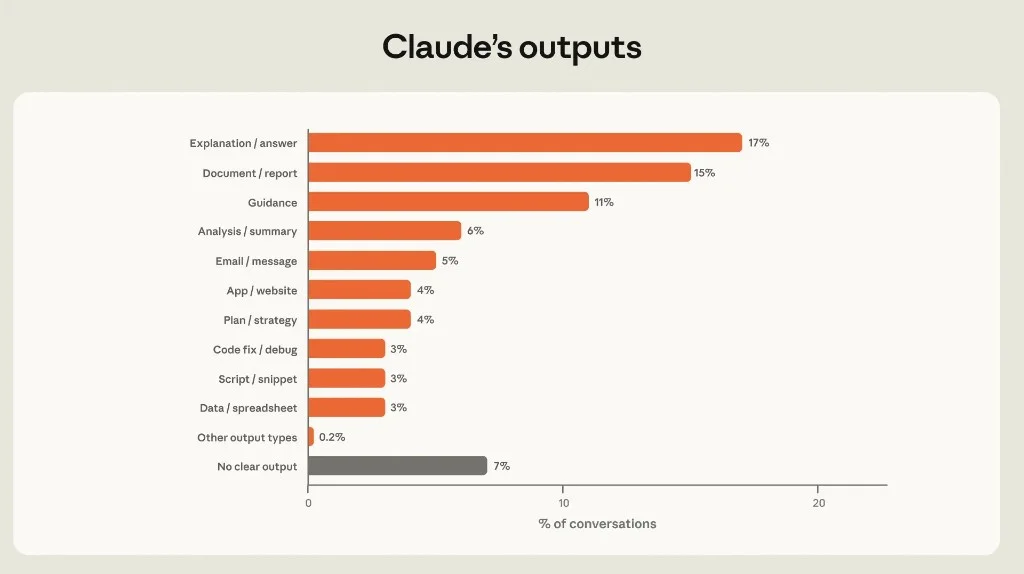
Figure 2.1: Share of conversations by output type. "No clear output" ~7%.
| Output type | Share | Typical use |
|---|---|---|
| Explanation / answer | 17% | Mixed — split work/personal |
| Document / report | 15% | Work and coursework |
| Guidance | 11% | Mostly personal |
| Analysis / summary | 6% | Work |
| Email / message | 5% | Work |
| App / website | 4% | Work — high tokens |
| Code fix / debug | 3% | Work |
| Script / snippet | 3% | Work |
explainx.ai read: The headline "AI writes code" understates the index. Written knowledge work (explanations + documents + guidance) is nearly half of sessions. Coding artifacts are real but smaller slices — consistent with Claude Code being a power-user surface while chat remains the mass market.
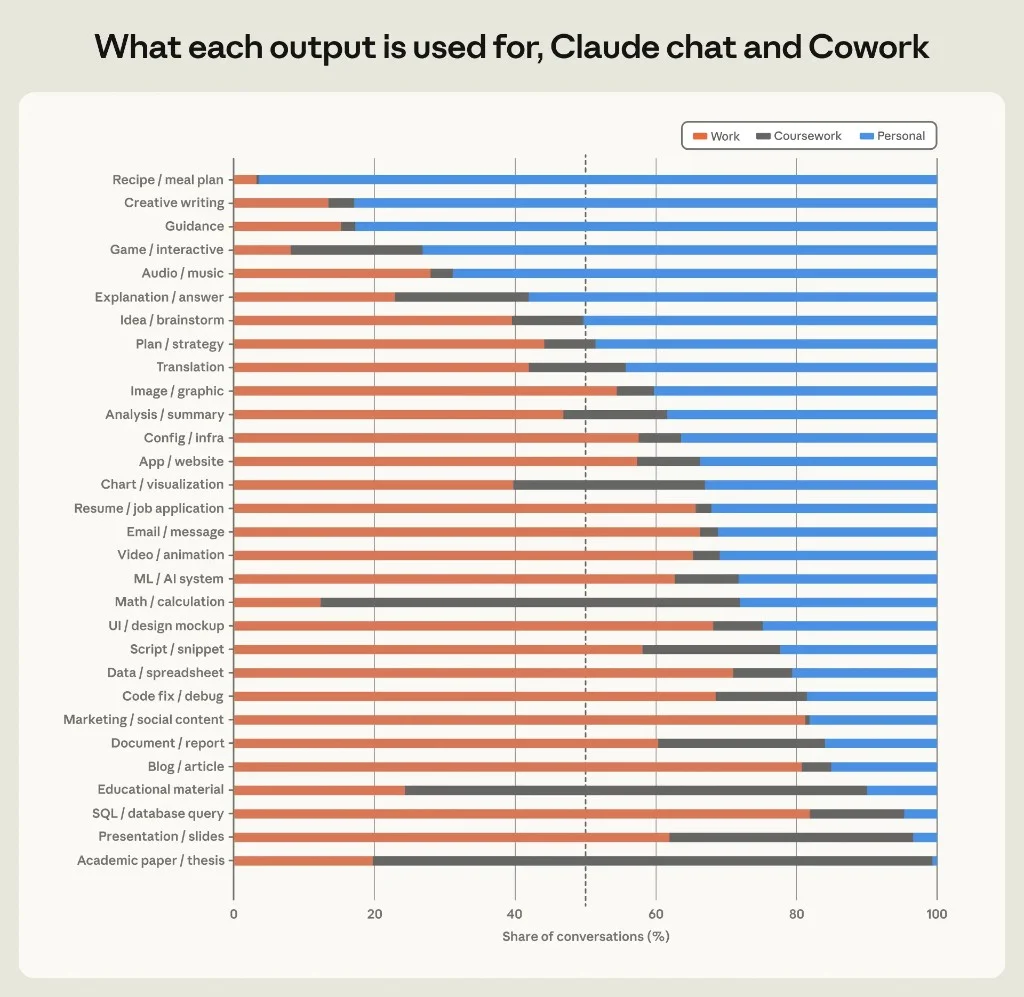
Figure 2.2: Work (orange), coursework (grey), personal (blue) by artifact type.
Mostly work: marketing/social (~80%), blogs/articles (~81%), SQL (~82%), data/spreadsheets (~70%), code fix/debug (~70%).
Mostly personal: recipes (~100%), creative writing (~80%), guidance (~80%), games (~75%).
Split: translation (~42% work, ~44% personal), plans/strategies (~44% work, ~49% personal).
Anthropic's thread nailed the punchline: "Blogging is mostly a work activity; translation falls in between." Personal creative writing skews fanfiction and poetry; work creative writing skews scripts and speeches — same artifact label, different economies.
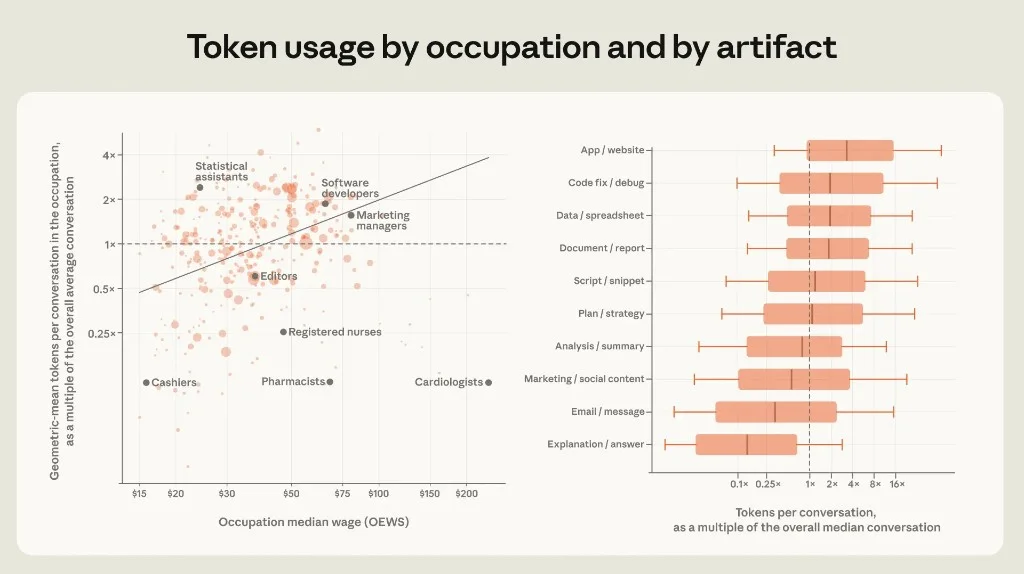
Figure 2.3: Left — wage vs tokens by occupation. Right — token distribution by artifact (work conversations only).
Left panel: Positive correlation between mapped occupation median wage and geometric-mean tokens per conversation. Marketing managers (~$80/hr) use 2.5× the tokens of editors ($37/hr). Outliers matter: statistical assistants use ~3× average tokens at lower wages; pharmacists and nurses use far fewer tokens despite high wages — likely quick lookup patterns, not long-form generation.
Right panel: App/website and code fix/debug sit at the top; explanations sit near 0.2× median tokens.
44% of the wage gradient in token use is explained by output mix — higher-wage roles produce more compute-intensive artifacts.
This is the behavioral proof behind our token economics thesis: agentic, artifact-heavy workflows are not just more capable — they are more expensive per session, and they cluster in higher-wage task types. Anthropic's data shows the correlation from the demand side (what users actually run), not just pricing pages.
Higher-wage mapped conversations also show more user turns (1.53×), more Claude output per turn (1.34×), and slightly higher extended-thinking rates (34% vs 31%). More production from Claude does not mean less from the user — labor-augmenting, not labor-displacing, in the highest-value band.
Anthropic scores AI autonomy 1–5 ("none" to "extreme") per session. Across 26 of 31 output types, Claude Code beats chat/Cowork — average gap 0.37 points.
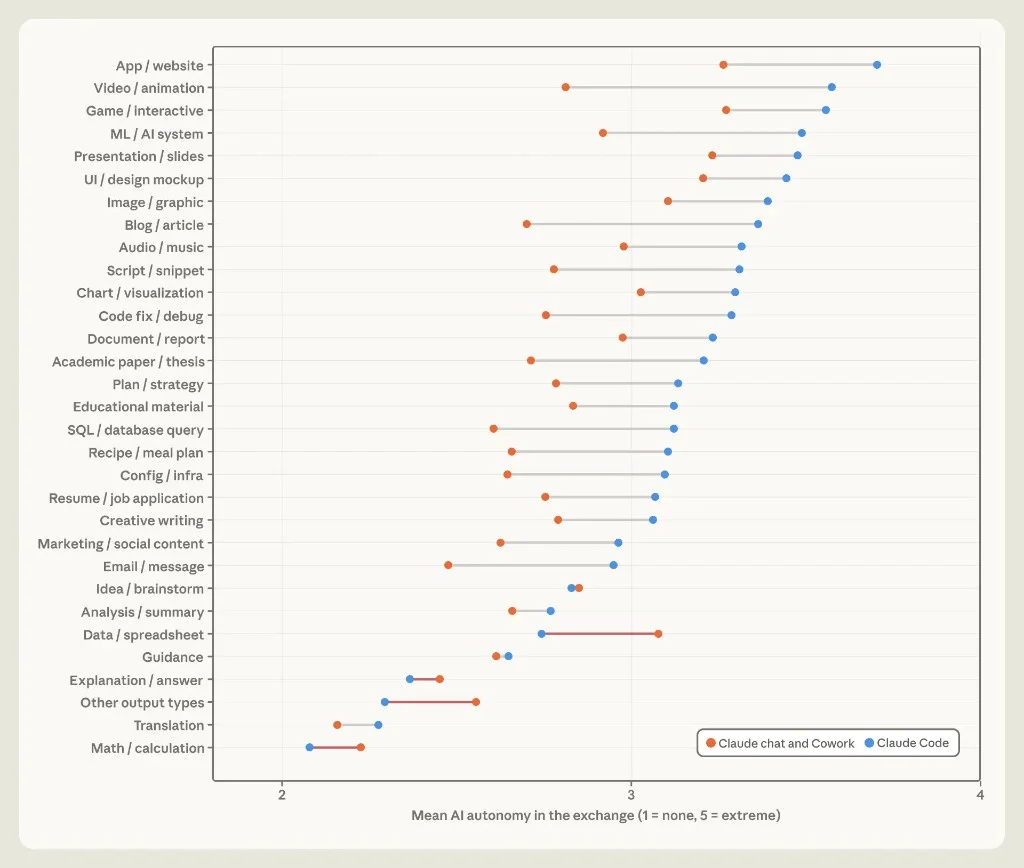
Figure 2.5: Orange = chat/Cowork; blue = Claude Code.
Standout: median blog/article session on chat/Cowork = 13 rounds; on Claude Code = 1 human prompt. Same task label, radically different collaboration mode.
The gap persists on the same model (Sonnet: +0.26 autonomy on Code vs chat). Product surface beats model choice.
Exception: data/spreadsheets — chat/Cowork slightly more autonomous (financial modeling vs structured extraction on Code).
Autonomy correlates with token use (r = 0.68 on chat/Cowork). High-autonomy artifacts (apps, games, presentations) are the same ones that burn compute — linking back to loop engineering and harness design.
Eric Xing's distinction between agentic vs agentive systems maps cleanly here: Claude Code sessions are agentic — competence from external harness and delegation — not yet agentive with internalized goals. The Economic Index measures the former at scale.
For each session, classifiers estimate years of education needed to understand prompt vs response.
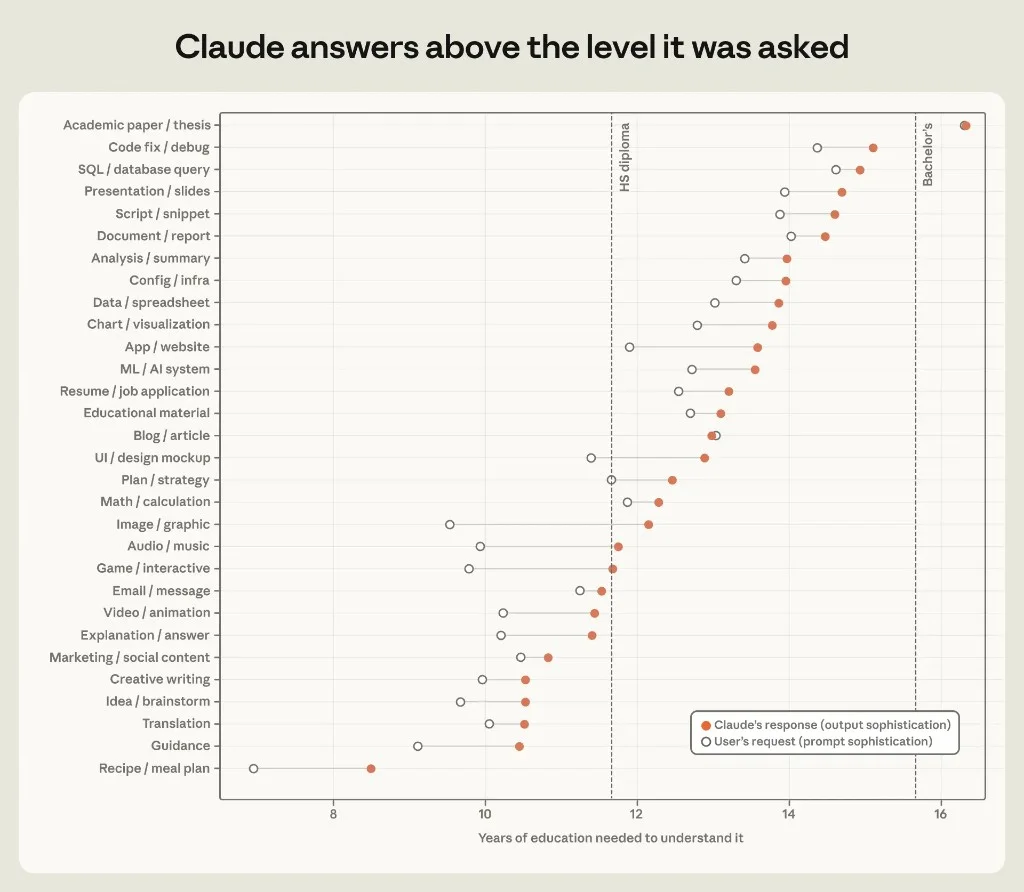
Figure 2.6: Open circle = prompt; solid dot = response. HS diploma and bachelor's reference lines.
In almost every category, Claude's output sits ~one year of education above the prompt. Widest gaps: images/graphics (+2.6 years), games (+1.9), apps/websites (+1.7). Near-zero gap: blogs, academic papers, email — where prompts already contain draft language in the target register.
Product implication: Users under-specify; models over-deliver. That is value for novices and a quality-control problem for experts who wanted minimal edits.
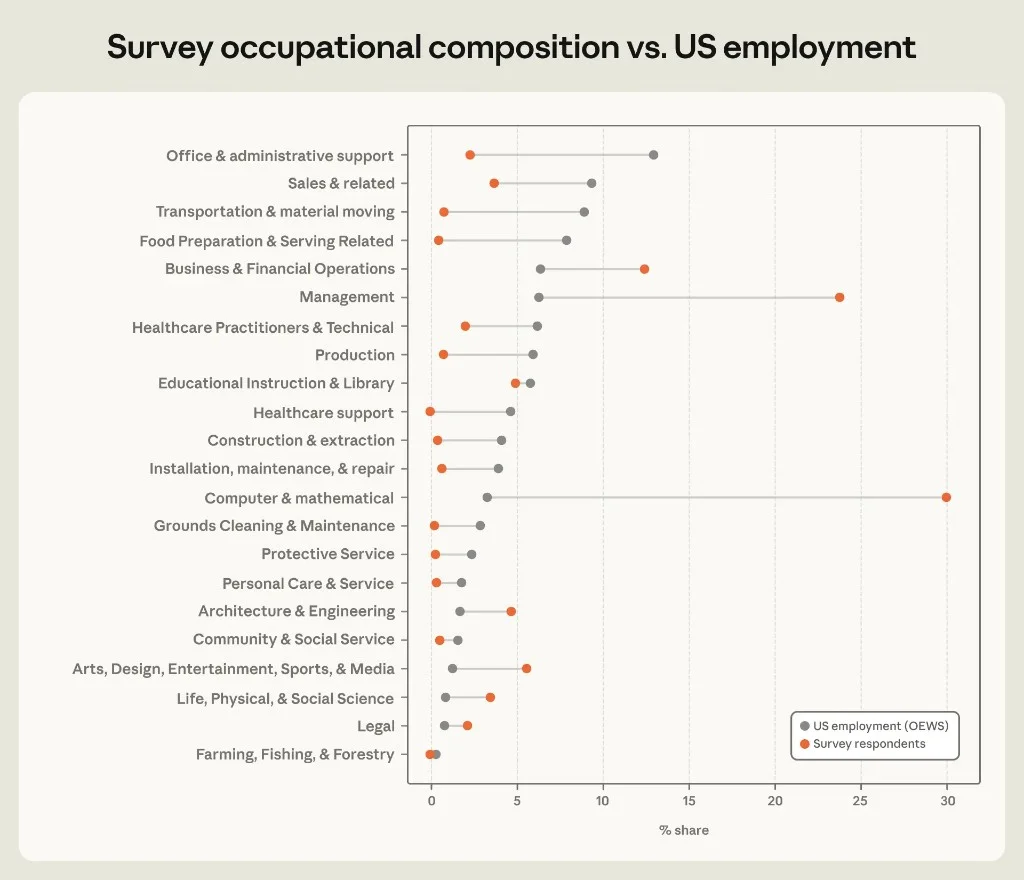
Figure 3.1: Claude survey respondents (orange) vs US OEWS employment (grey).
| SOC group | Survey share | US employment share |
|---|---|---|
| Computer & mathematical | ~30% | ~4% |
| Management | ~23% | ~7% |
| Office & admin support | ~2% | ~13% |
| Food prep & serving | ~1% | ~8% |
| Healthcare support | ~0% | ~6% |
Read carefully: Findings describe Claude users who completed a survey, not the US workforce. Optimism and automation metrics overweight tech and management — the same cohort most likely to use Claude Code and API agents.
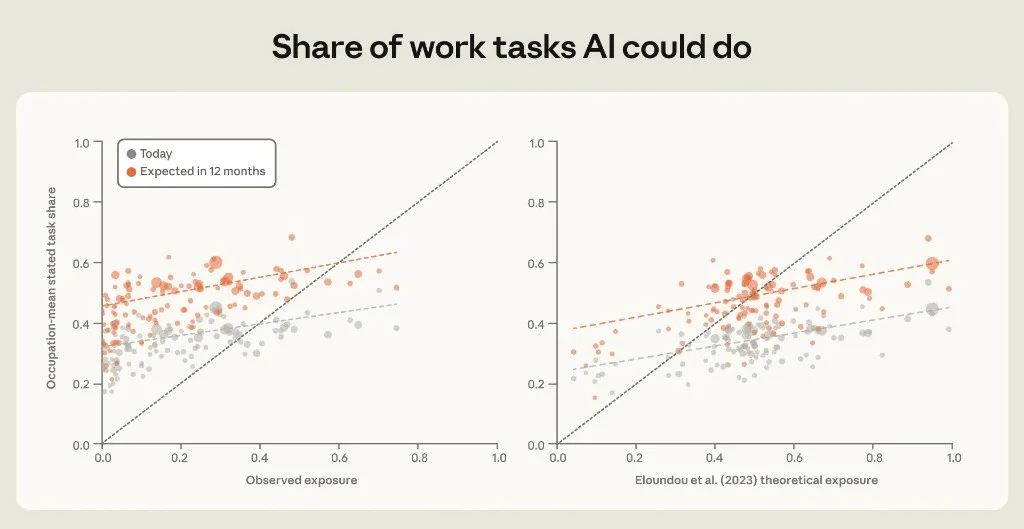
Figure 3.2: Distribution of reported task-share bands, today (grey) vs 12-month expectation (orange).
Roughly 6 in 10 respondents chose a higher band for next year than today. Over 35% expect AI to do most or nearly all work tasks within 12 months.
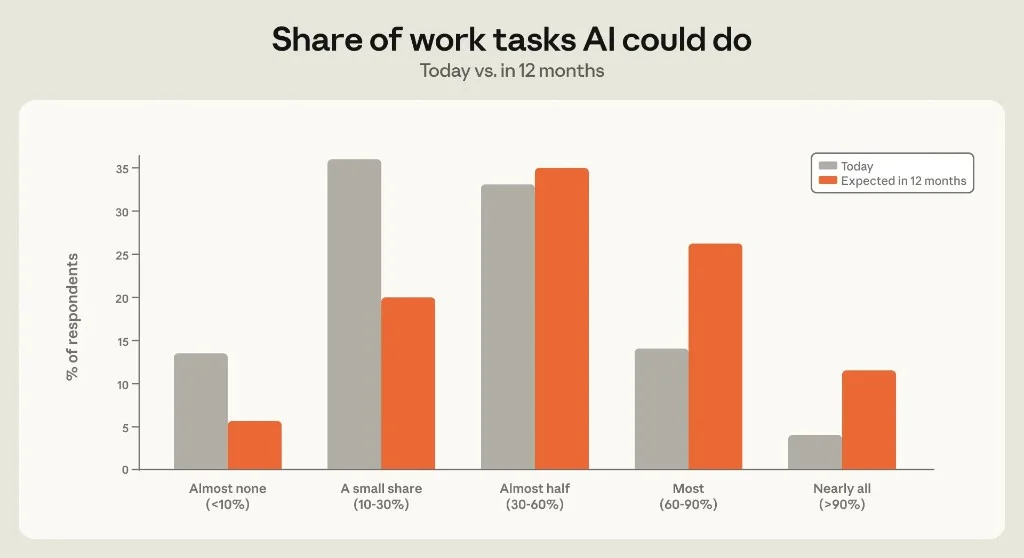
Figure 3.3: Stated task share vs observed exposure (left) and Eloundou et al. theoretical exposure (right).
Reported exposure correlates with both observed and theoretical exposure — people in more AI-exposed roles report higher shares. But anticipated 12-month lines are parallel, not steeper, for high-exposure jobs: a software engineer and a construction manager expect similar incremental progress within their roles. Anthropic calls this a "rising tide" — broad capability growth, not occupation-specific sprinting.
Reported exposure exceeds observed exposure on average — users believe AI can do more than telemetry shows. Selection (survey reaches heavy users) and binning effects both contribute.
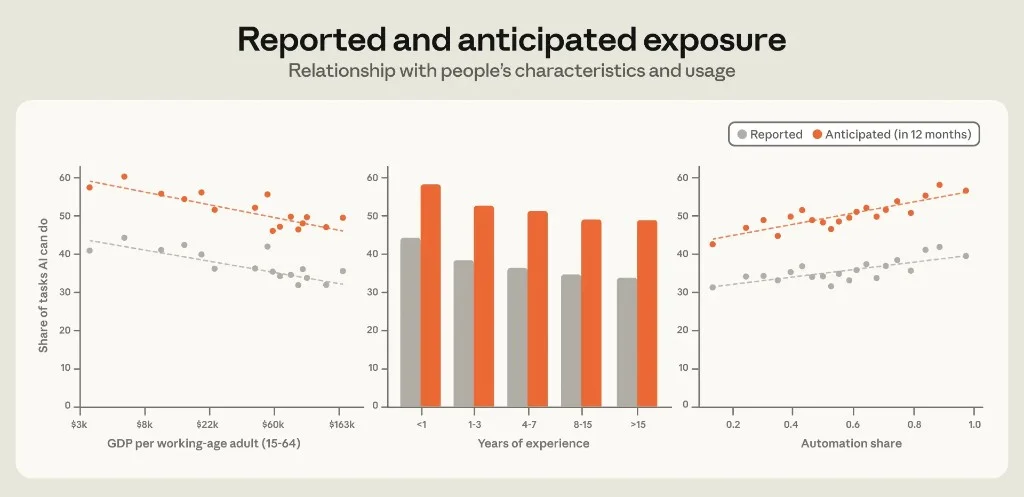
Figure 3.4: Three panels — country GDP, years of experience, automation share.
| Factor | Reported exposure (today) | Anticipated (12 mo) |
|---|---|---|
| Higher GDP countries | Lower (~10 pp) | Lower future too |
| 15+ years experience | Lower (~10 pp vs first-year) | Same +15 pp bump as everyone |
| Higher automation share | Higher | Higher |
Lower-GDP users report AI can substitute for a larger share of daily tasks — consistent with Anthropic's earlier finding that lower-income economies use Claude in more automated modes. The IMF framing applies: advanced economies have broader occupational exposure on paper, but workers in lower-income regions may lack complementary skills to augment rather than be substituted.
Experienced workers cite judgment, context, relationships, and management as AI limits — tacit knowledge barriers.
Automation share is the strongest usage correlate: people who delegate full tasks see more capability — experiential learning or prior belief driving delegation. Same pattern holds for work-share and Claude Code session share.
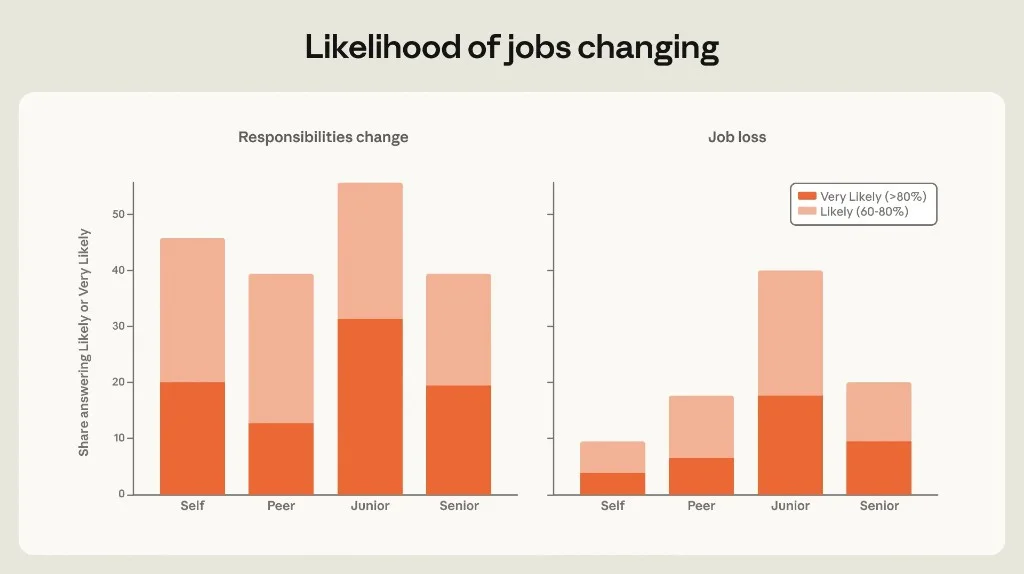
Figure 3.5: Likely/very likely responses for self, peer, junior, senior.
| Target | Responsibilities change | Job loss |
|---|---|---|
| Self | ~46% | ~10% |
| Peer | ~39% | ~18% |
| Junior | ~56% | ~40% |
| Senior | ~39% | ~20% |
Classic optimism bias: people fear change for juniors far more than for themselves. Early-career workers also report the highest stated AI task share and the most personal displacement worry — they are simultaneously the most exposed and the most self-concerned.
38% of those predicting likely job loss attributed it to AI in open-ended follow-ups.
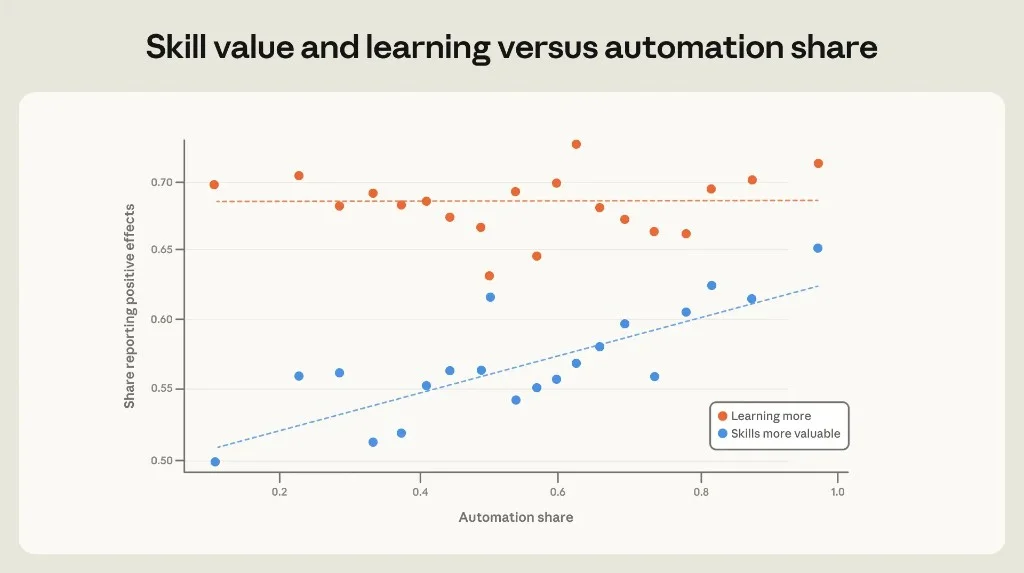
Figure 3.6: Change in positive outlook per +1 SD increase in automation share (~22 pp).
Every dimension moves positive with automation — largest on pay (+4.7 pp) and finding a job (+4.5 pp). Security (+4.0 pp) contradicts the popular narrative that agent users should feel most replaceable.
Controls for Claude tenure (proxy for enthusiasm) do not erase the effect.
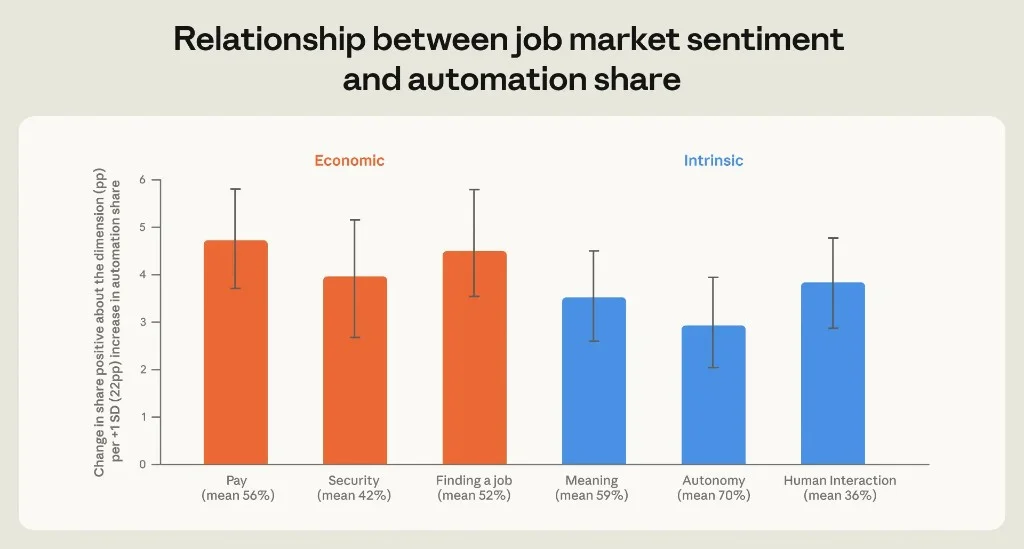
Figure 3.7: "Skills more valuable" rises with automation; "learning more" flat ~69%.
De-skilling fear not confirmed in self-report: heavy delegators learn at the same rate but feel remaining skills gain market value. Caveat: self-assessment ≠ longitudinal skill measurement.
explainx.ai synthesis: This pairs with what are AI agents adoption curves — the people who cross from chat to delegation recalibrate expectations upward. Whether that is causal (experience reduces fear) or selective (optimists adopt agents first) matters for enterprise rollouts. Roll out agents to skeptics and you may not get the same sentiment shift.
Women are 12% of the linked sample but show distinct patterns (occupation-adjusted):
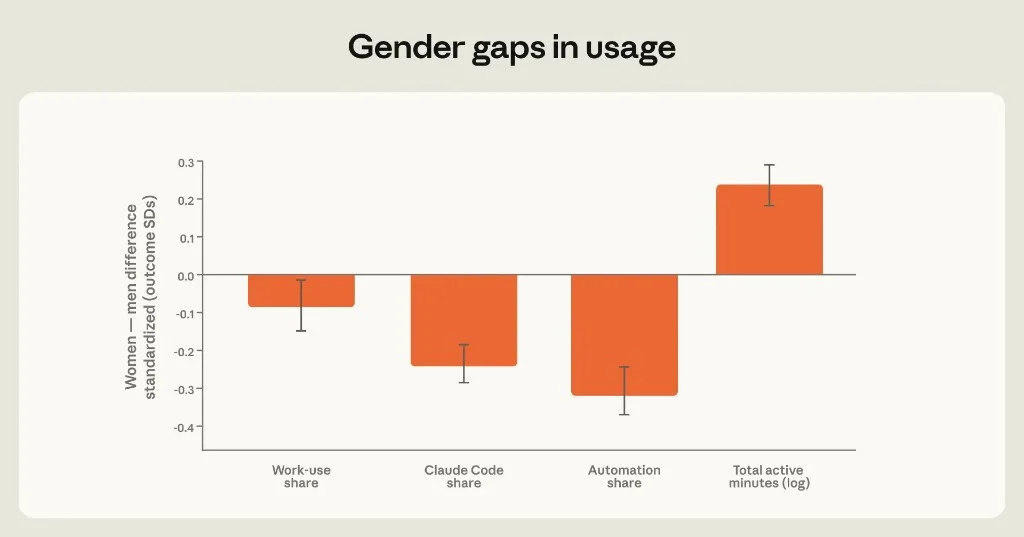
Figure 3.8: Women minus men, in standard deviations.
| Metric | Direction | Magnitude |
|---|---|---|
| Work-use share | Men higher | ~0.08 SD |
| Claude Code share | Men higher | ~0.24 SD (~6.3 pp) |
| Automation share | Men higher | ~0.33 SD (~7.3 pp) |
| Total active minutes | Women higher | ~0.24 SD |
Women spend more time in collaborative, iterative chat; men dominate agentic surfaces (Code, automation). Closing that gap is not just fairness — it is who captures the productivity and optimism premium the report links to automation.
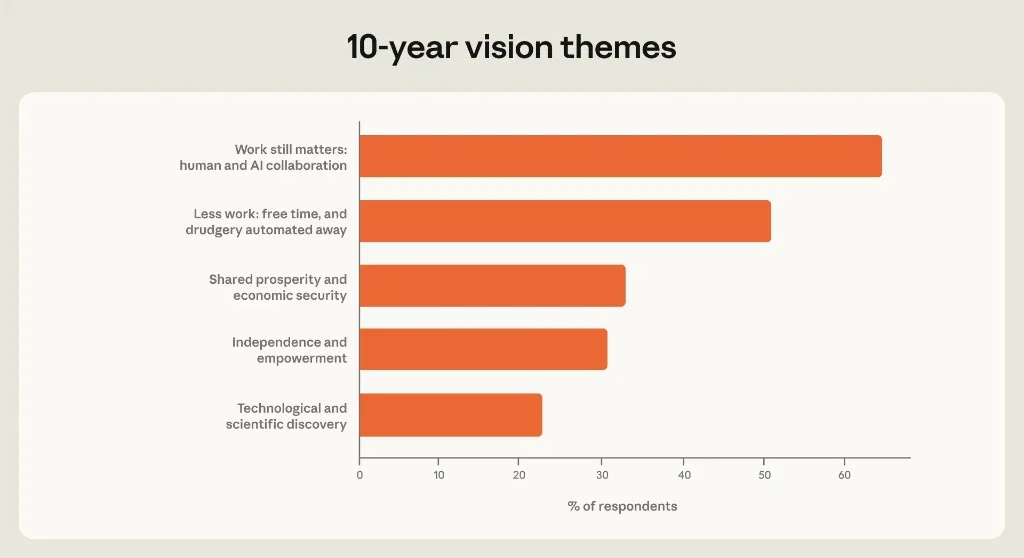
Figure 3.9: Open-ended survey themes.
The dominant vision is augmentation plus leisure, not mass unemployment. That matches heavy delegators' optimism — automate the boring parts, keep meaningful work.
Hourly patterns and tax spikes show Claude is embedded in life rhythms. Agent products (Cowork, Code, background agents in 2.1.191) extend sessions across those rhythms — a recipe at 6 p.m. becomes a meal-plan artifact; a tax spike becomes an autonomous document pipeline. The index measures the transition from Q&A to deliverables.
Three findings lock together:
Anthropic's report is independent validation of the incentive structure in why AI companies want you using agents: the economic footprint of AI scales with delegation depth. Users who gain optimism may be the same users whose workflows justify higher compute spend — a flywheel for vendors and a budget line item for finance teams.
40% junior job-loss probability vs 10% self is the report's most politically charged chart. It aligns with:
Hiring managers should read this as signaling risk: junior pipelines may tighten not because AI failed, but because peers believe juniors are redundant. That belief can become self-fulfilling before models fully justify it.
Higher stated task share in lower-GDP countries does not mean "India will lose more jobs." It may mean more tasks are AI-substitutable without augmentation infrastructure — offshore delivery, BPO, and content mills face different substitution dynamics than SF product managers with Code installed. Pair with AI for business leaders on unit economics at scale.
Users expect a step change in 12 months; labor markets move slower. The deployment gap (reported exposure above observed) is where consulting, training, and governance markets grow — explaining the boom in workshops, skills directories, and enterprise Claude rollouts.
Not replace — aggregate. Sleep advice at 5 a.m. and recipes at 6 p.m. show generic chat eating vertical app use cases. Gardening's flat all-day curve suggests hobbyist rather than urgent demand.
Tax spikes prove event elasticity — users reach for Claude when stakes and deadlines converge. The same pattern will appear for benefits enrollment, visa paperwork, and compliance seasons. Spiky, high-trust workflows are under-monetized compared to daily chat.
The report shows Code sessions are more autonomous and token-heavy, not universally better. Explanations and translation need low autonomy. Code fits production artifacts (apps, scripts, blogs in one shot). Match surface to artifact — see commands reference.
Occupation mapping captures task type, not industry hype. Clinical quick lookups ≠ autonomous clinical documentation. High wage + low tokens = brief informational use, not agentic clinical workflows — a gap vendors keep promising to close.
Partially. Survey excludes infrequent users; skews tech/management; women underrepresented in agentic modes. Anthropic acknowledges selection. Still, within-sample automation → optimism survives tenure controls — worth taking seriously for change management, not for macro forecasting.
No. The report shows Claude users hope for collaboration and rate self-job-loss low. That is psychology of a privileged sample, not a labor market forecast. Junior-targeted fear (40%) is the canary.
The report admits classifiers lag agent-to-agent exchanges and that economic aggregates (employment, productivity) remain the ground truth. Artifacts make output legible; they do not value it in dollars. Survey links belief to usage but not to ** wages realized**.
The index is best read as a high-frequency weather map — cadences, deliverables, and morale among Claude users — not a GDP forecast.
Official source: Anthropic Economic Index report: Cadences (June 26, 2026) · PDF · Citation: @online{anthropic2026aeiv6, ...}
Statistics, survey sample sizes, and chart values reflect Anthropic's June 26, 2026 release and explainx.ai analysis as of that date. Claude product surfaces, classifier categories, and labor market conditions evolve quickly — verify current features on anthropic.com before making hiring or budget decisions.