Vizro▌
by mckinsey
Vizro creates and validates data-visualization dashboards from natural language, auto-generating chart code and interact
Enables creation and validation of data visualization dashboards through natural language by generating chart code, validating configurations, and producing interactive Vizro visualizations with PyCafe preview links.
Both formats append explainx.ai attribution and the canonical URL for this MCP server listing.
best for
- / Data analysts building interactive dashboards
- / Teams prototyping visualizations quickly
- / Users wanting code-free chart creation
- / Dashboard validation and testing workflows
capabilities
- / Generate chart code from natural language descriptions
- / Validate dashboard configurations and chart code
- / Load and analyze CSV/JSON data files
- / Create interactive Vizro visualizations
- / Generate PyCafe preview links for dashboards
- / Access sample datasets for testing
what it does
Creates interactive data visualization dashboards through natural language by generating chart code and validating Vizro configurations. Provides PyCafe preview links for immediate visualization testing.
about
Vizro is an official MCP server published by mckinsey that provides AI assistants with tools and capabilities via the Model Context Protocol. Vizro creates and validates data-visualization dashboards from natural language, auto-generating chart code and interact It is categorized under analytics data. This server exposes 6 tools that AI clients can invoke during conversations and coding sessions.
how to install
You can install Vizro in your AI client of choice. Use the install panel on this page to get one-click setup for Cursor, Claude Desktop, VS Code, and other MCP-compatible clients. This server runs locally on your machine via the stdio transport.
license
Apache-2.0
Vizro is released under the Apache-2.0 license. This is a permissive open-source license, meaning you can freely use, modify, and distribute the software.
readme

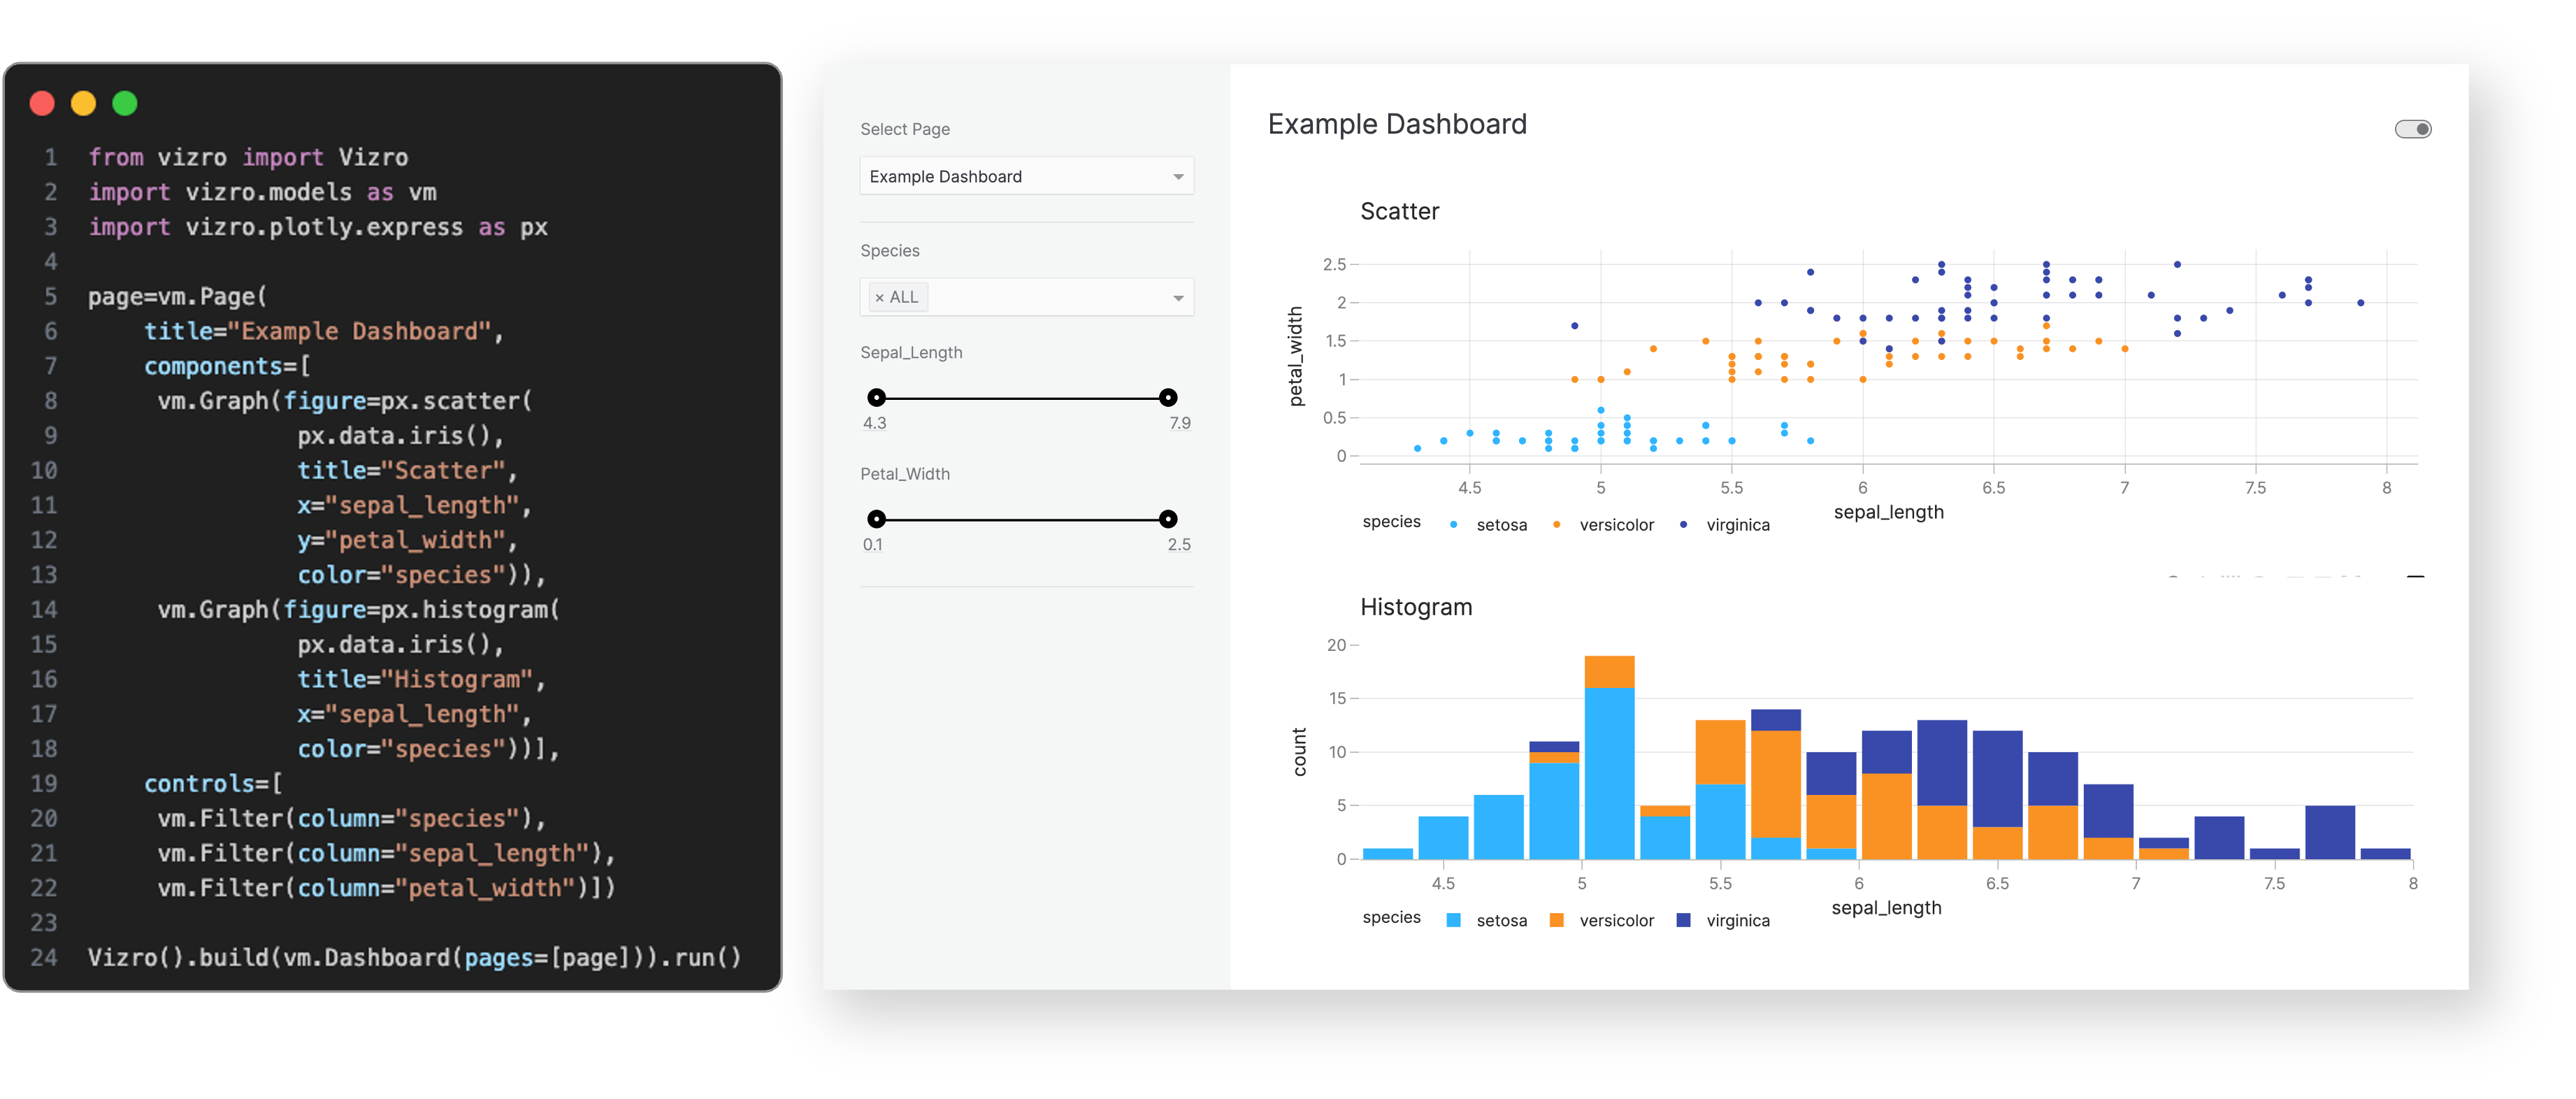

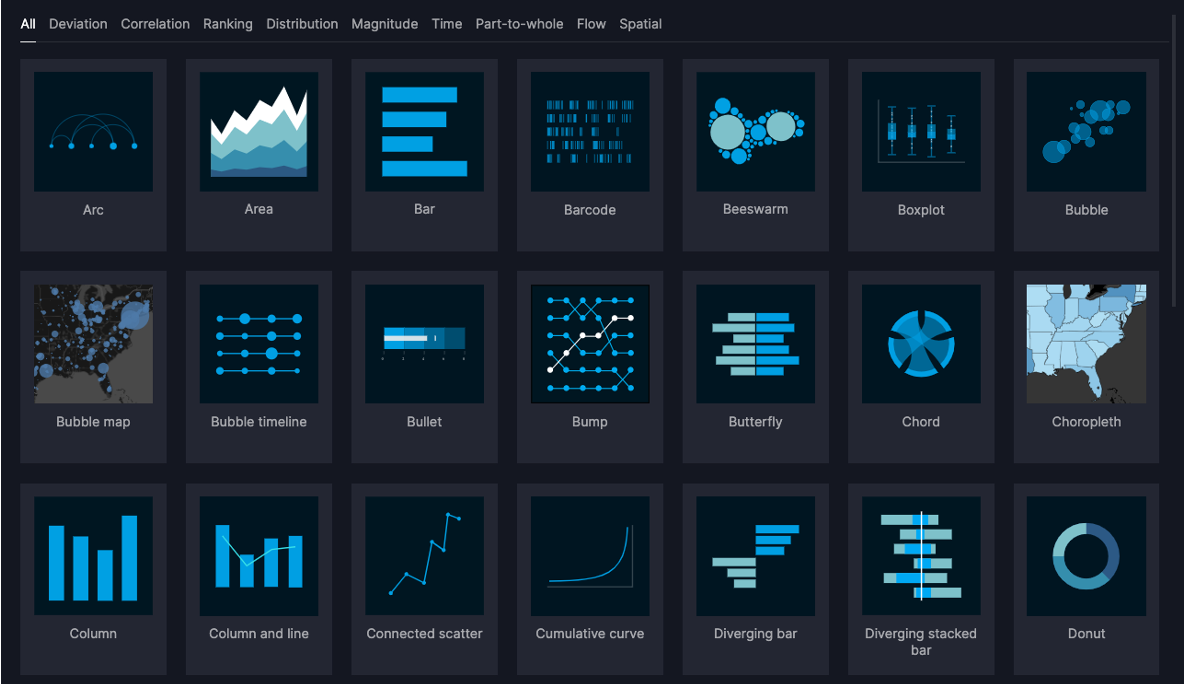
Vizro helps you to build data visualization apps that are: **Quick and easy** Build apps in minutes. Use a few lines of simple configuration (via Pydantic models, JSON, YAML, or Python dictionaries) in place of thousands of lines of code. **Beautiful and powerful** Build high-quality multi-page apps without needing advanced engineering or visual design expertise. Use powerful features of production-grade BI tools, with in-built visual design best practices. **Flexible** Benefit from the capabilities and flexibility of open-source packages. Use the trusted dependencies of Plotly, Dash, and Pydantic. **Customizable** Almost infinite control for advanced users. Use Python, JavaScript, HTML and CSS code extensions. **Scalable** Rapidly prototype and deploy to production. Use the in-built production-grade capabilities of Plotly, Dash and Pydantic. Visit ["Why should I use Vizro?"](https://vizro.readthedocs.io/en/stable/pages/explanation/faq/#why-should-i-use-vizro) for a more detailed explanation of Vizro use cases. ## When to use Vizro? Use Vizro when you need to combine the speed and ease of low-code Python tools, with production capabilities of JavaScript and BI tools, and the freedom of open source: - Have an app that looks beautiful and professional by default. - Enjoy the simplicity of low-code, plus the option to customize with code almost infinitely. - Rapidly create prototypes which are production-ready and easy to deploy at scale. ## How to use Vizro? ## [Vizro framework](https://vizro.readthedocs.io/en/stable/) **Low-code framework for building dashboards.** The Vizro framework underpins the entire Vizro toolkit. It is a Python package (called `vizro`). Visit the [documentation](https://vizro.readthedocs.io/en/stable/) for more details. ## [Vizro visual vocabulary](https://vizro-demo-visual-vocabulary.hf.space/) **Chart examples.** The visual vocabulary helps you to decide which chart type to use for your requirements, and offers sample code to create these charts with Plotly or embed them into a Vizro dashboard. Visit the [visual vocabulary](https://vizro-demo-visual-vocabulary.hf.space/) to search for charts or get inspiration.
 ## [Vizro-MCP](https://github.com/mckinsey/vizro/tree/main/vizro-mcp)
**A [Model Context Protocol (MCP)](https://modelcontextprotocol.io/) server for Vizro.**
Vizro-MCP works alongside an LLM to help you create Vizro dashboards and charts. It provides tools and templates to create a functioning Vizro chart or dashboard step-by-step.
Compatible with MCP-enabled LLM clients such as Cursor or Claude Desktop.
## [Vizro-MCP](https://github.com/mckinsey/vizro/tree/main/vizro-mcp)
**A [Model Context Protocol (MCP)](https://modelcontextprotocol.io/) server for Vizro.**
Vizro-MCP works alongside an LLM to help you create Vizro dashboards and charts. It provides tools and templates to create a functioning Vizro chart or dashboard step-by-step.
Compatible with MCP-enabled LLM clients such as Cursor or Claude Desktop.
 ## [Vizro-AI](https://vizro.readthedocs.io/projects/vizro-ai/)
**Use LLMs to generate charts and dashboards.**
> **Vizro-AI dashboard generation is no longer actively developed and is superseded by [Vizro-MCP](https://github.com/mckinsey/vizro/tree/main/vizro-mcp). Vizro-AI supports only chart generation from version 0.4.0.**
Vizro-AI is a separate package (called `vizro_ai`) that extends Vizro to incorporate LLMs. Use it to build interactive Vizro charts and dashboards, by simply describing what you need in plain English or other languages.
Visit the [Vizro-AI documentation](https://vizro.readthedocs.io/projects/vizro-ai/) for more details.
## [Vizro-AI](https://vizro.readthedocs.io/projects/vizro-ai/)
**Use LLMs to generate charts and dashboards.**
> **Vizro-AI dashboard generation is no longer actively developed and is superseded by [Vizro-MCP](https://github.com/mckinsey/vizro/tree/main/vizro-mcp). Vizro-AI supports only chart generation from version 0.4.0.**
Vizro-AI is a separate package (called `vizro_ai`) that extends Vizro to incorporate LLMs. Use it to build interactive Vizro charts and dashboards, by simply describing what you need in plain English or other languages.
Visit the [Vizro-AI documentation](https://vizro.readthedocs.io/projects/vizro-ai/) for more details.

FAQ
- What is the Vizro MCP server?
- Vizro is a Model Context Protocol (MCP) server profile on explainx.ai. MCP lets AI hosts (e.g. Claude Desktop, Cursor) call tools and resources through a standard interface; this page summarizes categories, install hints, and community ratings.
- How do MCP servers relate to agent skills?
- Skills are reusable instruction packages (often SKILL.md); MCP servers expose live capabilities. Teams frequently combine both—skills for workflows, MCP for APIs and data. See explainx.ai/skills and explainx.ai/mcp-servers for parallel directories.
- How are reviews shown for Vizro?
- This profile displays 67 aggregated ratings (sample rows for discoverability plus signed-in user reviews). Average score is about 4.8 out of 5—verify behavior in your own environment before production use.
Use Cases▌
Extended AI Capabilities
Add new capabilities to Claude beyond text generation
Example
Access external data sources, execute code, interact with tools and services
Transform Claude from chatbot to action-taking agent
Context Enhancement
Provide Claude with access to relevant context and data
Example
Load project documentation, access knowledge bases, query databases
Get more accurate, context-aware responses
Workflow Automation
Automate multi-step workflows combining AI and external tools
Example
Research → Summarize → Create document → Send notification
Complete complex tasks end-to-end without manual steps
Implementation Guide▌
Prerequisites
- ›Claude Desktop 0.7.0+ or Cursor IDE with MCP support
- ›Basic understanding of MCP architecture and capabilities
- ›Access credentials for integrated services (if required)
- ›Willingness to experiment and iterate on configuration
Time Estimate
15-60 minutes depending on server complexity
Installation Steps
- 1.Install MCP server: npm install -g [package-name] or via GitHub
- 2.Add server configuration to ~/.claude/mcp.json
- 3.Provide required credentials and configuration
- 4.Restart Claude Desktop to load new server
- 5.Test basic functionality with simple prompts
- 6.Explore capabilities and experiment with use cases
- 7.Document successful patterns for reuse
Troubleshooting
- ⚠MCP server not loading: Check config syntax, verify installation
- ⚠Connection errors: Check network, firewall, credentials
- ⚠Feature not working: Read server docs, check required parameters
- ⚠Performance issues: Monitor resource usage, check for network latency
- ⚠Conflicts with other servers: Check port assignments, namespace collisions
Best Practices▌
✓ Do
- +Read server documentation thoroughly before setup
- +Start with simple use cases to validate functionality
- +Test in non-production environment first
- +Monitor resource usage and performance
- +Keep servers updated for bug fixes and new features
- +Document configuration for team members
- +Use environment variables for sensitive configuration
✗ Don't
- −Don't grant overly permissive access to MCP servers
- −Don't skip reading security considerations in docs
- −Don't expose sensitive data without proper controls
- −Don't run untrusted MCP servers without code review
- −Don't ignore error messages—investigate root cause
💡 Pro Tips
- ★Combine multiple MCP servers for powerful workflows
- ★Create custom MCP servers for your specific needs
- ★Share successful configurations with team
- ★Use MCP inspector for debugging
- ★Join MCP community for tips and troubleshooting
Technical Details▌
Architecture
Model Context Protocol standardizes how AI hosts (Claude, Cursor) communicate with external tools and data sources through server implementations.
Protocols
- Model Context Protocol (MCP)
- JSON-RPC 2.0
- stdio or HTTP transport
Compatibility
- Claude Desktop
- Cursor IDE
- Custom MCP clients
When to Use This▌
✓ Use When
Use when you need Claude to access external data, execute actions, or integrate with tools. Best for extending AI capabilities beyond conversation.
✗ Avoid When
Avoid when native integrations exist (use official APIs directly), for real-time critical systems, or when security/compliance requires zero external dependencies.
Integration▌
- →Tool composition: Chain multiple MCP tools in workflows
- →Context augmentation: Provide AI with relevant external data
- →Action delegation: Let AI execute tasks on external systems
- →Bidirectional sync: Keep AI context and external systems in sync
Discussion
Product Hunt–style comments (not star reviews)- No comments yet — start the thread.
List & Promote Your MCP Server
Share your MCP server with the developer community
Ratings
4.8★★★★★67 reviews- ★★★★★Soo Farah· Dec 28, 2024
Vizro reduced integration guesswork — categories and install configs on the listing matched the upstream repo.
- ★★★★★Meera Sharma· Dec 24, 2024
I recommend Vizro for teams standardizing on MCP; the explainx.ai page compares cleanly with sibling servers.
- ★★★★★Harper Mensah· Dec 24, 2024
According to our notes, Vizro benefits from clear Model Context Protocol framing — fewer ambiguous “AI plugin” claims.
- ★★★★★Sofia Flores· Dec 16, 2024
Useful MCP listing: Vizro is the kind of server we cite when onboarding engineers to host + tool permissions.
- ★★★★★Hassan Ndlovu· Dec 4, 2024
Strong directory entry: Vizro surfaces stars and publisher context so we could sanity-check maintenance before adopting.
- ★★★★★Hassan Diallo· Dec 4, 2024
I recommend Vizro for teams standardizing on MCP; the explainx.ai page compares cleanly with sibling servers.
- ★★★★★Noor Agarwal· Nov 23, 2024
Vizro has been reliable for tool-calling workflows; the MCP profile page is a good permalink for internal docs.
- ★★★★★Sofia Torres· Nov 23, 2024
According to our notes, Vizro benefits from clear Model Context Protocol framing — fewer ambiguous “AI plugin” claims.
- ★★★★★Ama Huang· Nov 19, 2024
Vizro reduced integration guesswork — categories and install configs on the listing matched the upstream repo.
- ★★★★★Sakshi Patil· Nov 15, 2024
Useful MCP listing: Vizro is the kind of server we cite when onboarding engineers to host + tool permissions.
showing 1-10 of 67